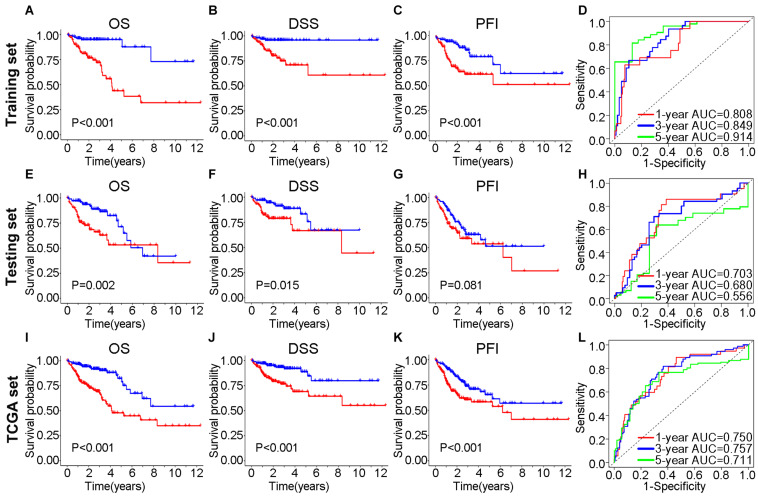
FIGURE 7.
Efficiency validation of the genome instability-associated lncRNA signature for prognostic prediction. In training set, Kaplan–Meier curves for OS (A), DSS (B) and PFI (C) of patients and the receiver operating characteristic (ROC) curves (D). In testing set, impact of prognostic risk on OS (E), DSS (F) and PFI (G) of patients and the ROC curves (H). In TCGA set, impact of prognostic risk on OS (I), DSS (J), and PFI (K) of patients and the ROC curves (L). OS, overall survival; DSS, disease-specific survival; PFI, progression-free interval; AUC, area under the curve.

