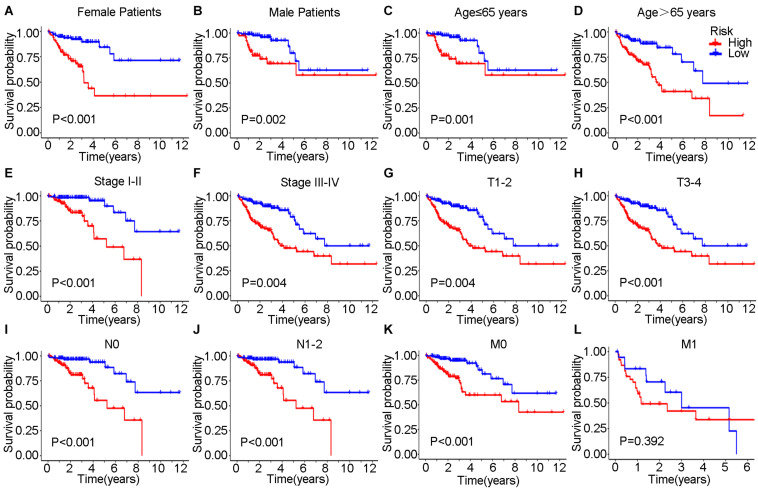
FIGURE 8.
Kaplan–Meier curves were performed for patients stratified by clinicopathological features in the TCGA set. Impact of prognostic risk on overall survival for female (A) and male patients (B); for patients younger than 65 years old (C) and older than 65 years old (D); for patients in stage I-II (E) and stage III-IV (F); for patients in stage T1-2 (G) and stage T3-4 (H); for patients in stage N0 (I) and stage N1-2 (J); and for patients in stage M0 (K) and stage M1 (L).

