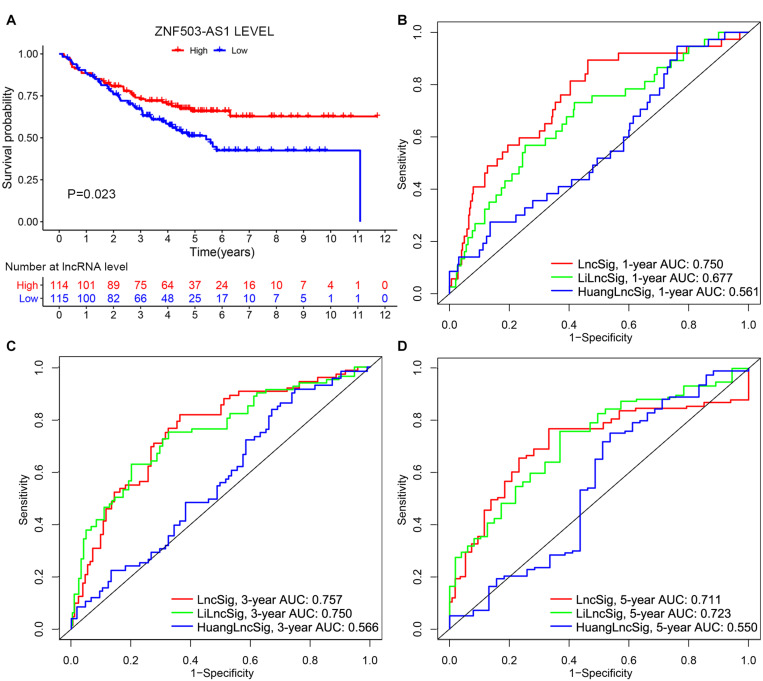
FIGURE 9.
Performance evaluation of lncRNA signature. (A) Independent validation of the lncRNA in lncRNA signature in the GSE17538 dataset. Kaplan–Meier curves illustrated that patients with low expression levels of ZNF503-AS1 had worse overall survival than those with high expression levels (P value = 0.023). 1-year (B), 3-year (C), and 5-year (D) receiver operating characteristic (ROC) analyses for our lncRNA signature (lncSig), Li lncRNA signature (LiLncSig) and Huang lncRNA signature (HuangLncSig). AUC, area under the curve.

