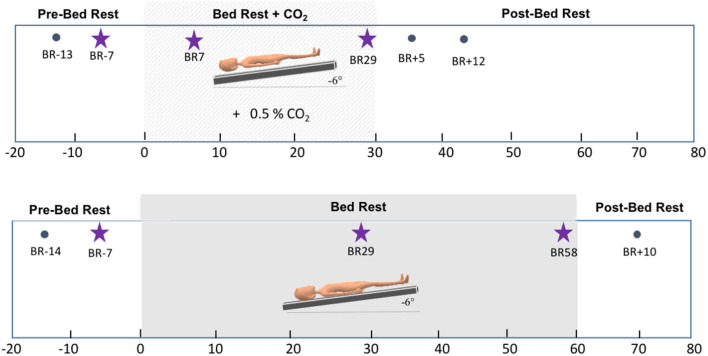
Figure 1.
Testing timelines. Top: testing timeline for the HDBR+CO2 group. The lighter gray box corresponds to the intervention time, i.e., 30 days of head-down tilt bed rest (HDBR) with 0.5% atmospheric CO2. Bottom: testing timeline for the HDBR group. The darker gray box corresponds to the intervention time, i.e., 60 days of HDBR with normal atmospheric CO2 levels. Stars indicate the three time points used to create the slope images for between-group comparisons.

