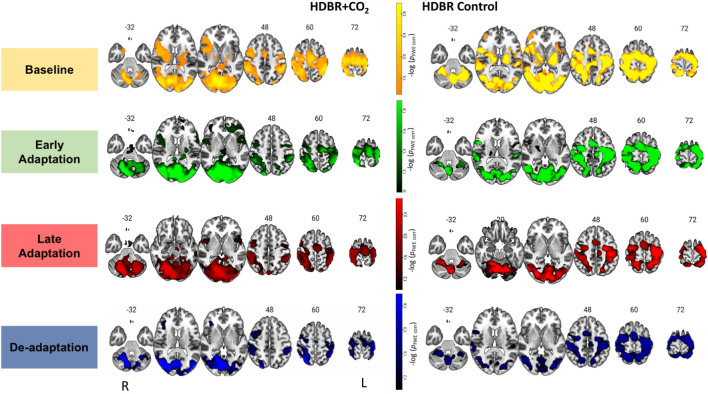
Figure 3.
Brain activation during each phase of visuomotor adaptation. Here we depict the main effect for each group HDBR+CO2 (left) and HDBR Control (right) during each task phase: baseline (yellow-orange), early (green), late (red), and de-adaptation (blue). Whole brain results are overlaid onto an MNI standard template, thresholded at FWE < 0.10 and k = 10 voxels. The color scale depicts the -log(pFWE-corr) values in which brighter colors (higher values) represent smaller p-values.

