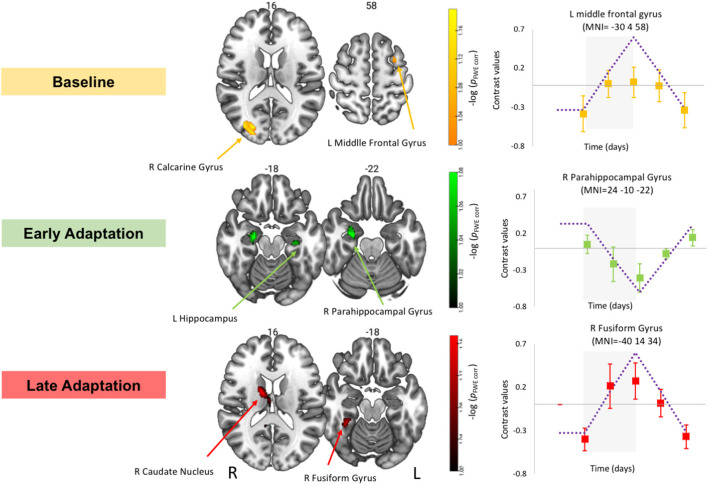
Figure 4.
Time course of the neural visuomotor adaptation response to HDBR+CO2. Left: Whole brain results showing increases in activation during the baseline (yellow) and late phases of adaptation (red) and decreases in activation during early adaptation (green) followed by recovery. Whole brain results are overlaid onto an MNI standard template, thresholded at FWE < 0.10 and k = 10 voxels. The color scale depicts the -log(pFWE-corr) values in which brighter colors (higher values) represent smaller p values. Right: Example contrast values plotted for peak coordinate within the cluster with the smallest p-value in each case. Squares represent group mean contrast values; error bars represent standard error. Purple dotted lines show the hypothesized longitudinal contrasts for “cumulative decrease” and “cumulative increase” during-HDBR+CO2 followed by recovery. Gray box represents the intervention time in days.

