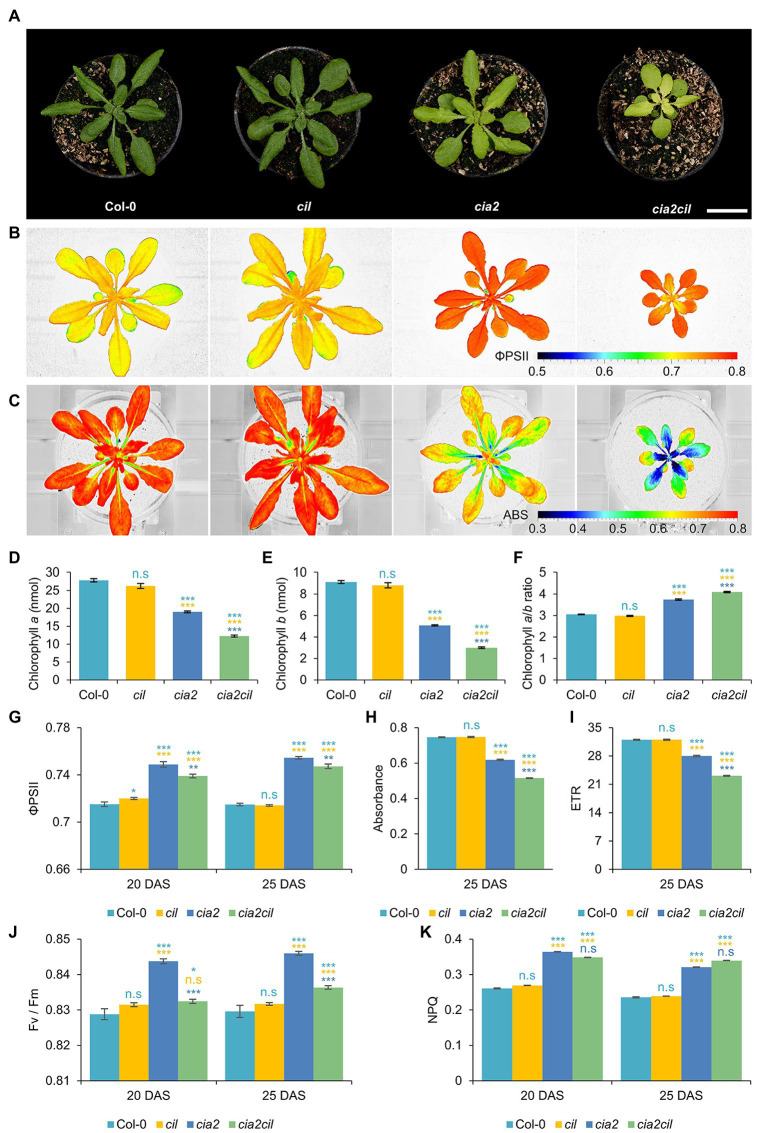
Figure 4.
Measurement of chlorophyll content and photosynthetic performance of wild type Col-0 and cil, cia2, and cia2cil mutants. (A) Phenotype of Col-0, cil, cia2, and cia2cil plants. Scale bar, 2 cm. (B) False-color images of the operating light use efficiency of PSII (ΦPSII). (C) False-color images of normalized difference vegetation index (NDVI) imaging of actinic light absorbance. (D–F) Quantification of chlorophyll a (D), chlorophyll b (E), and ratios of chlorophyll a to b (F). The chlorophyll content was measured for 50 mg leaf material. (G–K) Measurement of photosynthetic parameters. Results are presented as mean ± SEM. Number of plants used for chlorophyll content measurement N = 10; number of plants used for photosynthetic measurement N = 15. Student’s t-test (Tails = 2; Type = 2) significant levels, n.s, not significant; *p < 0.05; **p < 0.01; ***p < 0.001. From top to bottom: statistical analysis of significance was performed as compared to Col-0, cil, and cia2, respectively. ΦPSII, photosystem II operating efficiency; Absorbance, absorbance of actinic light; ETR, electron transport rate; Fv/Fm, maximum quantum yield of PSII photochemistry measured in the dark-adapted state; NPQ, non-photochemical quenching. DAS, days after sowing. Plants and images shown in panels (A–C) were at developmental stages 20 DAS. All photosynthetic measurements were performed at 120 μE actinic light.

