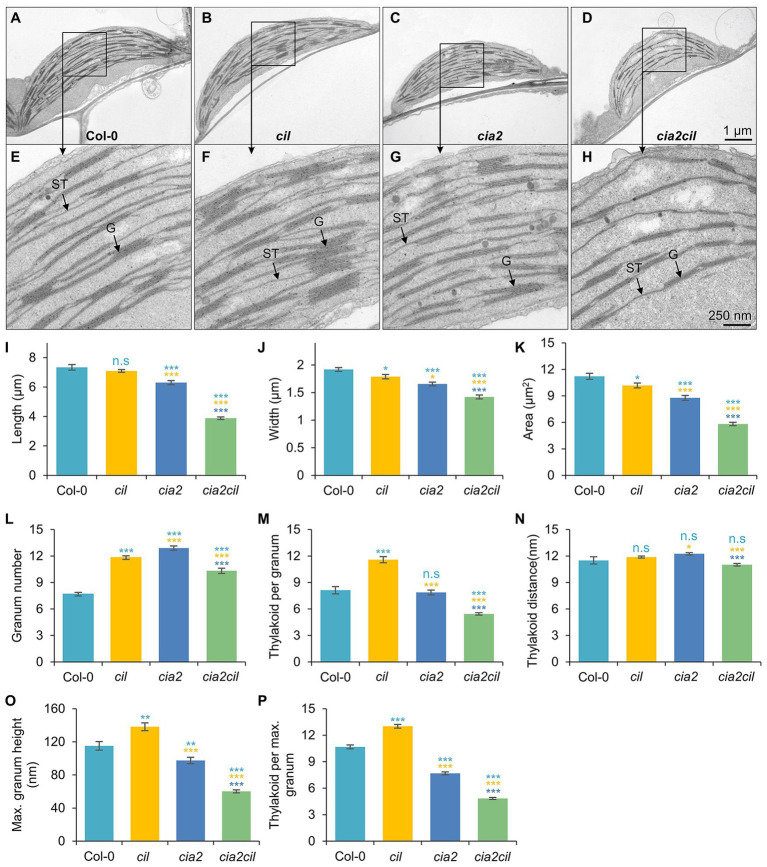
Figure 5.
Ultrastructural analysis of chloroplasts of the wild type Col-0, and cia2, cil, and cia2cil mutants. (A–H) Comparison of the chloroplast ultrastructure in wild type and mutants. Panels (E–H) represent larger magnification of marked areas of the corresponding plastid in the top panels (A–D), respectively. ST, stroma thylakoid; G, granum. (I–P) Quantification of chloroplast architecture and components of photosynthetic apparatus. The granum number (L) and thylakoid per granum (M) were counted within an area of 1 μm2. Maximum granum height (O) represents the granum with maximum number of thylakoid membranes within each chloroplast. Thylakoid per maximum granum (P) represents the number of thylakoid membranes within the highest granum. Results are presented as mean ± SEM (N ≥ 40). Student’s t-test (Tails = 2; Type = 3) significant levels, n.s, not significant; *p < 0.05; **p < 0.01; ***p < 0.001. From top to bottom: statistical analysis of significance was performed as compared to Col-0, cil, and cia2, respectively.

