

Abstract
Regulatory dendritic cells (DCreg) promote transplant tolerance following their adoptive transfer in experimental animals. We investigated the feasibility, safety, fate, and impact on host T cells of donor monocyte-derived DCreg infused into prospective, living donor liver transplant patients, 7 days before transplantation. The DCreg expressed a tolerogenic gene transcriptional profile, high cell surface programed death ligand-1 (PD-L1):CD86 ratios, high IL-10/no IL-12 productivity and poor ability to stimulate allogeneic T cell proliferation. Target DCreg doses (range 2.5–10 × 106 cells/kg) were achieved in all but 1 of 15 recipients, with no infusion reactions. Following DCreg infusion, transiently elevated levels of donor HLA and immunoregulatory PD-L1, CD39, and CD73 were detected in circulating small extracellular vesicles. At the same time, flow and advanced image stream analysis revealed intact DCreg and “cross-dressing” of host DCs in blood and lymph nodes. PD-L1 co-localization with donor HLA was observed at higher levels than with recipient HLA. Between DCreg infusion and transplantation, T-bethiEomeshi memory CD8+ T cells decreased, whereas regulatory (CD25hiCD127−Foxp3+): T-bethiEomeshi CD8+ T cell ratios increased. Thus, donor-derived DCreg infusion may induce systemic changes in host antigen-presenting cells and T cells potentially conducive to modulated anti-donor immune reactivity at the time of transplant.
Keywords: clinical research/practice, liver transplantation/hepatology, immunosuppression/immune modulation, immunobiology, dendritic cell, alloantigen, clinical trial, immune regulation, liver transplantation: living donor
1 |. INTRODUCTION
The potential of regulatory immune cell therapy to promote successful minimization/early withdrawal of conventional immunosuppression and the induction of transplant tolerance is well recognized.1–6 Consequently, early phase clinical trials aimed at testing the feasibility, safety, and preliminary efficacy of innate or adaptive regulatory immune cells are currently underway in kidney or liver transplantation.7–11 These include testing of ex vivo-expanded autologous polyclonal or donor antigen (Ag) alloreactive regulatory T cells (Tregs) and evaluation of ex vivo-generated regulatory myeloid cells—either donor-derived regulatory macrophages (Mreg),12,13 or regulatory dendritic cells (DCreg) of donor14 or host origin.15,16
Dendritic cells (DCs) are highly specialized, Ag-acquiring, processing, and presenting cells (APCs) with inherent tolerogenic properties17,18 that initiate, integrate, and regulate innate and adaptive immunity. In human liver transplantation, significant increases in circulating DCreg have been observed after tacrolimus to sirolimus conversion19 and at baseline, pre-weaning, in tolerant compared with non-tolerant patients.20 We have reported21 that in mice accepting liver allografts without immunosuppressive therapy, host DCs acquire donor MHC Ag via “cross-dressing,” express enhanced programed death ligand-1 (PD-L1) and inhibit anti-donor T cell responses. This suggests that, in addition to promoting allograft-targeted immune responses,22,23 host DCs that acquire donor major histocompatibility complex (MHC) Ags via cross-dressing can also promote transplant tolerance. Due to their immunoregulatory properties, DCreg are promising candidates for adoptive cell therapy of immune-mediated chronic inflammatory disorders.24 Thus, ex vivo-generated DCreg promote T cell tolerance in experimental autoimmune disease25 and organ transplantation2,15,26 by subverting naïve and memory T cell responses and augmentation of Tregs. Adoptive transfer of donor- or host-derived DCreg to allograft recipients before transplant can induce donor Ag-specific tolerance in rodents27–30 and promotes kidney graft survival in nonhuman primates (NHP).31,32
In healthy volunteers, injection of monocyte-derived immature DCs pulsed with influenza matrix peptide and keyhole limpet hemocyanin inhibits Ag-specific effector T cell function and induces Ag (peptide)-specific Tregs in vivo.33,34 In early phase trials, the safety of locally administered autologous DCreg has been reported in patients with type-1 diabetes,35 rheumatoid arthritis,36 Crohn’s colitis37 and, following iv administration, in patients with multiple sclerosis.38 Recently, we described39 a protocol for ex vivo generation of human DCreg from elutriated blood monocytes in the presence of vitamin D3 and IL-10. These agents inhibit DC maturation,40–42 confer resistance to maturation, and promote the ability of the cells to induce Ag-specific T cell unresponsiveness.39 In addition, we have described14 the rationale for a first-in-human trial of donor-derived DCreg infusion prior to living donor liver transplantation (LDLT) combined with triple drug immunosuppression (steroid taper, mycophenolate mofetil, and tacrolimus) for promotion of operational tolerance. The rationale for pre-transplant administration of DCreg is based both on the efficacy of this approach in rodent models and on the safety and efficacy of donor-derived DCreg infusion before transplant in a NHP model31 that proved more effective than autologous, donor antigen-pulsed DCreg infusion before transplant.32
Here, we report on the generation and properties of good manufacturing process (GMP) grade donor-derived DCreg and their safety following infusion into prospective LDLT recipients. We also describe consequent enhanced expression of human leukocyte antigen (HLA) and immunoregulatory molecules by circulating small extracellular vesicles (sEVs), together with cross-dressing of recipient APCs. DCreg infusion also led to alterations in CD8+ T memory and Treg populations between the time of DCreg infusion and graft implantation, with no evidence of pre-transplant sensitization to donor determined by no changes in the pattern reactivity and mean fluorescence intensity (MFI) of donor-specific antibodies (DSA) measured by single antigen Luminex assay before and after infusion.
2 |. MATERIALS AND METHODS
2.1 |. Patients
Fifteen LDLT donor-recipient pairs were recruited between September 2017 and January 2020 and following informed consent at the University of Pittsburgh Medical Center were enrolled into a phase I/II single-center, prospective open-label, non-controlled, non-randomized interventional study (NCT03164265; IRB# 19020267) to evaluate the feasibility, safety, and preliminary efficacy of a single, donor-derived DCreg infusion with concurrent mycophenolic acid administration at half-dose, 7 days prior to transplantation. Patient demographics and clinical characteristics are listed in Table 1.
TABLE 1.
Clinical demographics of enrolled trial patients
| Recipient ID | Recipient sex | Recipient age | Recipient weight (kg) | Primary disease | WBC at infusion (106/ml) | Donor sex | Donor age | Donor weight (kg) | HLA mismatches | DSA Pre-DCreg infusion | DSA post-DCreg infusion | Adverse reaction to infusion |
|---|---|---|---|---|---|---|---|---|---|---|---|---|
| Pat 1001 | M | 59 | 90 | NASH | 5.7 | F | 33 | 91 | A2, B2, C2, DR1, DRw0, DQ0, DP0 | − | − | None |
| Pat 1002 | F | 57 | 96 | HCC+NASH | 3.0 | F | 32 | 42 | A2, B1, C2, DR1, DRw0, DQ1, DP0 | − | − | None |
| Pat 1003 | M | 29 | 74 | Biliary Atresia | 2.7 | F | 26 | 58 | A1, B2, C0, DR2, DRw0, DQ2, DP2 | − | − | None |
| Pat 1004 | M | 69 | 95 | Alcoholic cirrhosis | 2.7 | F | 42 | 77 | A1, B0, C0, DR0, DRw0, DQ0, DP0 | − | − | None |
| Pat 1005 | M | 64 | 87 | NASH | 5.0 | F | 33 | 60 | A1, B2, C1, DR2, DRw0, DQ1, DP1 | − | − | None |
| Pat 1006 | F | 64 | 57 | HCC+NASH | 2.7 | M | 22 | 74 | A2, B2, C2, DR1, DRw0, DQ0, DP1 | − | − | None |
| Pat 1007 | F | 50 | 64 | Alcoholic cirrhosis | 7.7 | M | 55 | 91 | A1, B2, C2, DR1, DRw1, DQ2, DP0 | − | − | None |
| Pat 1008 | F | 68 | 75 | NASH | 6.9 | F | 45 | 62 | A1, B1, C0, DR1, DRw1, DQ1, DP1 | − | − | None |
| Pat 1009 | M | 62 | 131 | NASH+Alcoholic cirrhosis | 3.5 | F | 54 | 58 | A0, B0, C0, DR0, DRw0, DP0 | − | − | None |
| Pat 1010 | F | 62 | 66 | HCV | 1.7 | M | 31 | 98 | A1, B1, C0, DR0, DRw0, DQ0, DP0 | + | + | None |
| Pat 1011 | F | 66 | 69 | Alcoholic cirrhosis | 3.5 | F | 33 | 61 | A2, B2, C1, DR0, DRw0, DQ0, DP0 | + | + | None |
| Pat 1012 | F | 69 | 76 | NASH | 5.6 | F | 34 | 73 | A2, B1, C1, DR2, DRw0, DQ1, DP1 | + | + | None |
| Pat 1013 | F | 67 | 85 | HCC+NASH+HCV | 6.4 | F | 45 | 69 | A2, B2, C2, DR1, DRw1, DQ1, DP0 | − | − | None |
| Pat 1015 | M | 65 | 95 | Idiopathic | 6.0 | M | 45 | 95 | A1, B1, C1, DR1, DRw1, DQ0, DP0 | − | − | None |
| Pat 1016 | M | 48 | 90 | Alcoholic cirrhosis | 3.5 | F | 45 | 59 | A1, B2, C1, DR2, DRw1, DQ2, DP2 | − | − | None |
2.2 |. GMP-grade DCreg and control DC generation, phenotypic analysis, mixed leukocyte reactions (MLRs), and monitoring of host T cells
Details of these procedures are found in the Data S1.
2.3 |. Gene expression analysis
Total RNA was extracted from DC using a RNeasy Mini Kit (Qiagen) per the manufacturer’s instructions. NanoString analysis was similarly performed using a nCounter® Human Immunology v2 Panel (Catalogue number XT-CSO-HIM2-12, NanoString Technologies) as described.21,43 Gene expression data were log2-transformed and normalized to the geometric mean expression of 15 house-keeping genes using the nSolver software platform 4.0 (NanoString Technologies). Pathways were analyzed using Ingenuity Pathway Analysis (IPA) software (Qiagen).
2.4 |. Detection of cross-dressed cells in vitro
DCreg were spiked into a set volume of allogeneic whole blood from a healthy control equivalent to 1:10 ratio to white blood cells (WBC) and incubated for 18 h at 37C and 5% CO2. Red blood cells (RBC) were then lysed using ACK lysis buffer (Gibco) and the WBC blocked with mouse serum (Invitrogen) and stained with mAb, including HLA, as described for flow cytometry (FC) analysis.
2.5 |. Imaging of intact donor DCreg and cross-dressed cells ex vivo
Infused DCreg were tracked in recipient’s blood by FC and Image Stream (ImS) analysis. Blood was drawn before DCreg infusion (pre-inf) on day −7, 1 h after completion of infusion (post-inf), 3 days before liver transplant (day −3), and immediately before graft implantation on day 0. RBC in 0.5 ml of whole blood were lysed, WBC washed with phosphate-buffered saline, blocked, mAb stained (Table S2), and fixed in 1% paraformaldehyde. Infused DCreg and host DC or monocytes were distinguished by staining with donor and patient-specific HLA-A or B class I-specific mAb (Table S2). For ImS analysis, WBC were stained with donor- and patient-specific HLA-specific mAb, as well as with anti-CD11c, HLA-DR, and PD-L1 (Table S2), washed, and enriched by FACS-sort of lineage− HLA-DR+CD11c+ cells before acquisition in a Amnis Mark II ImS analyzer and analyzed using wizards Spot Count and co-localization with Amnis IDEAS software (Luminex).
2.6 |. sEV analysis
sEVs were isolated from donor and recipient platelet-poor plasma samples using total exosome isolation kits (Invitrogen) after passing through a 0.2 um membrane filter. Purity was verified by Nanosight (<200 nm). For HLA-A2 exosome analysis, biotinylated HLA-A2 (Biolegend; 343322) followed by PE-avidin (NeutrAvidin™; Thermo Fisher Scientific) was used and track analyses were performed using NS300 unit (Malvern) as previously described.44 Protein levels were quantified by Western Blot, as described45 using Abs directed against the exosome marker CD9 (Biolegend; 31210), used as a loading control,46 PD-L1 (E1L3N), CD73 (D7F9A) (Cell Signaling Technology), and CD86 (ab269587), CD39 (ab108248) (Abcam). Band intensity was quantified using ImageJ software and fold-change determined in relation to CD9.
2.7 |. Statistical analysis
Means ± SEM were calculated and differences compared across groups using paired or unpaired two-tail Student’s “t” tests, or unpaired Mann-Whitney or paired Wilcoxon “t” tests, according to data distribution. In some instances, one-way ANOVA followed by Tukey’s multiple comparison test was used. For gene expression and IPA, significance values were calculated based on Fisher’s right tailed exact test. Differences were considered significant if “p” was ≤.05.
3 |. RESULTS
3.1 |. Quality control testing and infusion of GMP DCreg
All 15 GMP DCreg products underwent rigorous quality control testing, phenotypic, and functional characterization to meet release criteria (Table S1). All products surpassed >70% viability (83–100%) and exceeded >97% purity with <5% CD19+ and <1% CD3+ (except patient 1011) cell contamination. Resistance to maturation and regulatory function were validated post-release for all products by high IL-10:IL-12 ratio following CD40L stimulation (Table 2). Thirteen of 15 products additionally expressed a PD-L1:CD86 ratio >2.5, shown to be associated with the induction of alloreactive T cell hyporesponsiveness.34 Mean donor DCreg yield was 429 ± 157 × 106 cells, enough to infuse all recipients within the target dose range (2.5–10 × 106 cells/kg), with the exception of patient 1013, who received 1.6 × 10⁶ cells/kg from a single leukapheresis product (Table 2). No infusion reactions or other significant adverse events occurred.
TABLE 2.
Manufacturing and phenotype of infused DCreg products
| Recipient ID | # Donor leukaphereses | # Donor monocytes elutriated (×109) | Viability (%) | # DCregs generated (×106) | # DCregs infused (×106) | Dose infused (DCreg 106/kg)a | IL−10:IL−12 ratiob | PD-L1/CD86 ratioc |
|---|---|---|---|---|---|---|---|---|
| Pat 1001 | 1 | 1.9 | 88 | 603 | 543 | 5.3 | 7 | 3.7 |
| Pat 1002 | 2 | 1.6 | 83 | 346 | 311 | 2.9 | 10 | 3.6 |
| Pat 1003 | 1 | 2.6 | 96 | 655 | 590 | 7.0 | 105 | 5.3 |
| Pat 1004 | 1 | 2.0 | 98 | 625 | 563 | 5.3 | 26 | 9.3 |
| Pat 1005 | 1 | 1.7 | 95 | 374 | 354 | 4.1 | 22 | 3.0 |
| Pat 1006 | 1 | 2.0 | 98 | 498 | 473 | 8.3 | 48 | 3.8 |
| Pat 1007 | 1 | 3.0 | 98 | 499 | 456 | 8.7 | 40 | 1.2 |
| Pat 1008 | 1 | 1.6 | 100 | 320 | 298 | 4.0 | 45 | 2.3 |
| Pat 1009 | 2 | 2.5 | 97 | 565 | 548 | 4.2 | 52 | 3.5 |
| Pat 1010 | 1 | 1.5 | 97 | 568 | 547 | 8.3 | 79 | 3.6 |
| Pat 1011 | 1 | 2.4 | 89 | 245 | 221 | 3.2 | 15 | 1.8 |
| Pat 1012 | 1 | 1.3 | 91 | 379 | 348 | 4.6 | 34 | 7.5 |
| Pat 1013 | 1 | 0.7 | 94 | 141 | 137 | 1.6d | 27 | 5.8 |
| Pat 1015 | 1 | 1.5 | 97 | 245 | 240 | 2.6 | 89 | 3.5 |
| Pat 1016 | 1 | 1.6 | 92 | 377 | 368 | 4.1 | 17 | 4.5 |
| Mean (±SD) | – | 1.9 (±0.6) | 94 (±5) | 429 (±157) | 400 (±142) | 4.9 (±2.2) | 41 (±30) | 4.2 (±2.1) |
Target cell dose: 2.5–10 × 106/kg.
IL-10:IL-12 ratio post-release; stimulation with J558-CD40L cell line.
PD-L1/CD86 ratio >2.5 indicating DCreg phenotype, post-release.
Sub-target dose infused.
3.2 |. DCreg gene expression profile
We examined gene expression profiles of GMP DCreg generated from three study donors and concomitant control immature (im) DC, both in the steady-state and following lipopolysaccharide (LPS) stimulation. Hierarchical cluster heat maps revealed distinct transcriptional profiles of each DC group. Overall, 446 genes were differentially expressed between DCreg and imDC. LPS stimulation triggered significant transcriptional changes in imDC, but only minimal change in DCreg, indicating their resistance to maturation (Figure 1A). We further quantified differential expression of seven selected genes described previously to contribute to regulation of T cell responses. The transcription factor IRF-4, that mediates Th2 immunity,47 CD1a, that defines a DC subset associated with high IL-12 production48 and lysosomal-associated membrane protein 3 (LAMP3; decreased expression of which may enhance DC tolerogenicity),49 were each downregulated in DCreg, but not in imDC. By contrast, S100A8, that inhibits DC maturation and Ag presentation50 was upregulated. CD80 and CD86 gene expression by DCreg was lower compared with imDC, even after LPS stimulation, whereas PD-L1 gene expression relative to CD80 and CD86 was upregulated (Figure 1B). Canonical pathways involved in DC maturation, NF-κB signaling, and Th1/Th2 responses were significantly inhibited in DCreg. Conversely, following exposure to LPS, activation of pro-inflammatory pathways, including IL-6, NF-κB signaling, and Th2 response was observed in imDC compared to DCreg (Figure 1C,D). These data confirm a tolerogenic profile of GMP DCreg.
FIGURE 1.
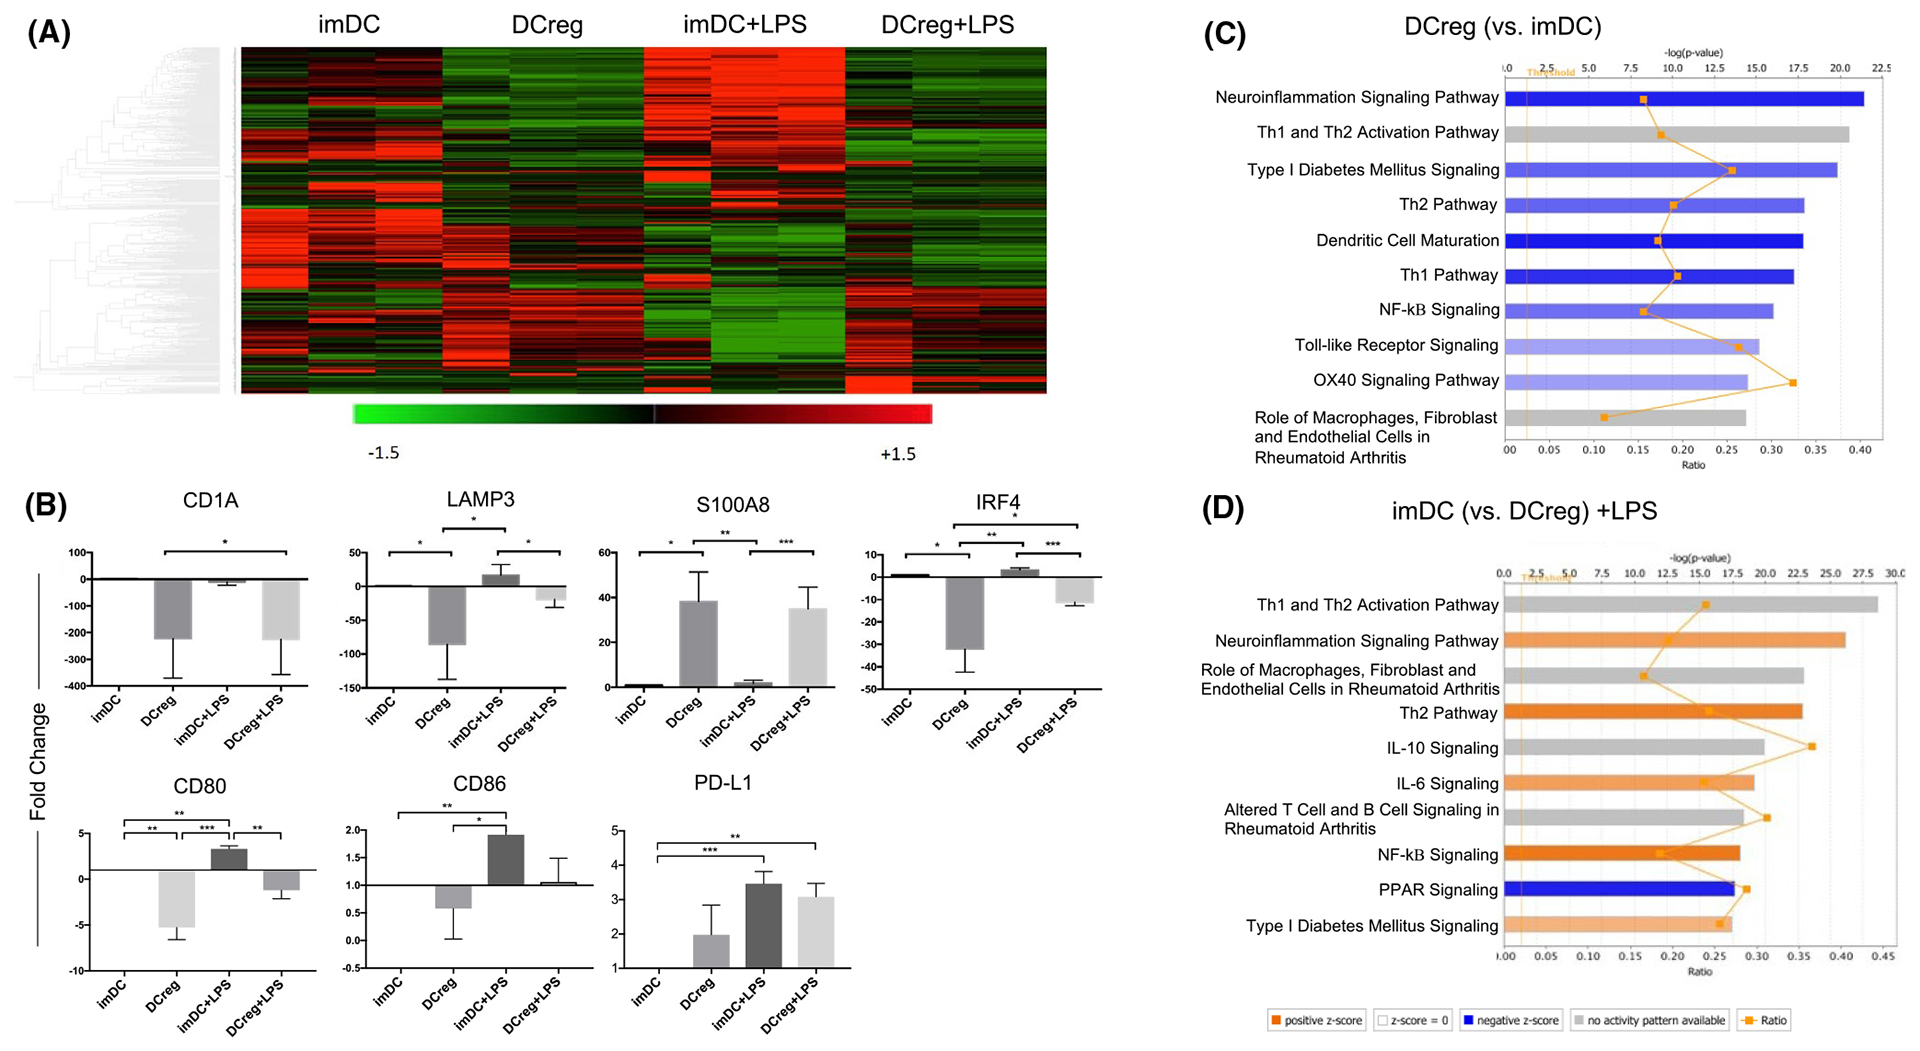
Transcriptional analysis of DCreg compared to immature (im)DC cultured in the presence or absence of LPS. (A) 446 gene profiles shown as a heatmap. Red color indicates increased gene expression and green color indicates decreased expression. (B) The top 7 genes that significantly changed (by fold-change) when comparing DCreg and imDC, with or without LPS stimulation. Ingenuity Pathway Analysis software was used to compare canonical pathways between groups: (C) DCreg with imDC and (D) imDC+LPS with DCreg+LPS. Bar graphs indicate either predicted pathway activation (orange) or inhibition (blue) based on the z-score gene expression on canonical pathways. Gray bars denote pathways ineligible for prediction assessment. The significance of the findings is indicated by −log (p value) shown on the horizontal axis at the top. Interconnected orange points represent the ratio between the number of input genes matched to a given pathway to the total number of genes that constitute the pathway based on prior literature. n = 3 individual donors in each group. *p < .05, **p < .01, ***p < .001
3.3 |. DCreg exhibit a distinct phenotype
We performed FC analysis of GMP DCreg compared with concomitant control mature (m)DC generated from 14 donors. DCreg were predominantly CD141+ and expressed significantly lower levels of HLA-DR, the maturation marker CD83 and T cell co-stimulatory CD80/CD86 compared with mDC. These markers were 2–4.5 times higher on mDC than on DCreg (Figure 2A,B). Although DCreg and mDC expressed similar levels of PD-L1, the mean PD-L1:CD86 MFI ratio was three times higher on DCreg (Figure 2C). Additionally, consistent with transcriptional analysis, i.c. staining revealed much lower levels of IRF4 in DCreg compared to mDC. Taken together with their high IL-10 and minimal/no IL-12 production (Table 2), these data indicate a distinct immune regulatory phenotype of DCreg.
FIGURE 2.
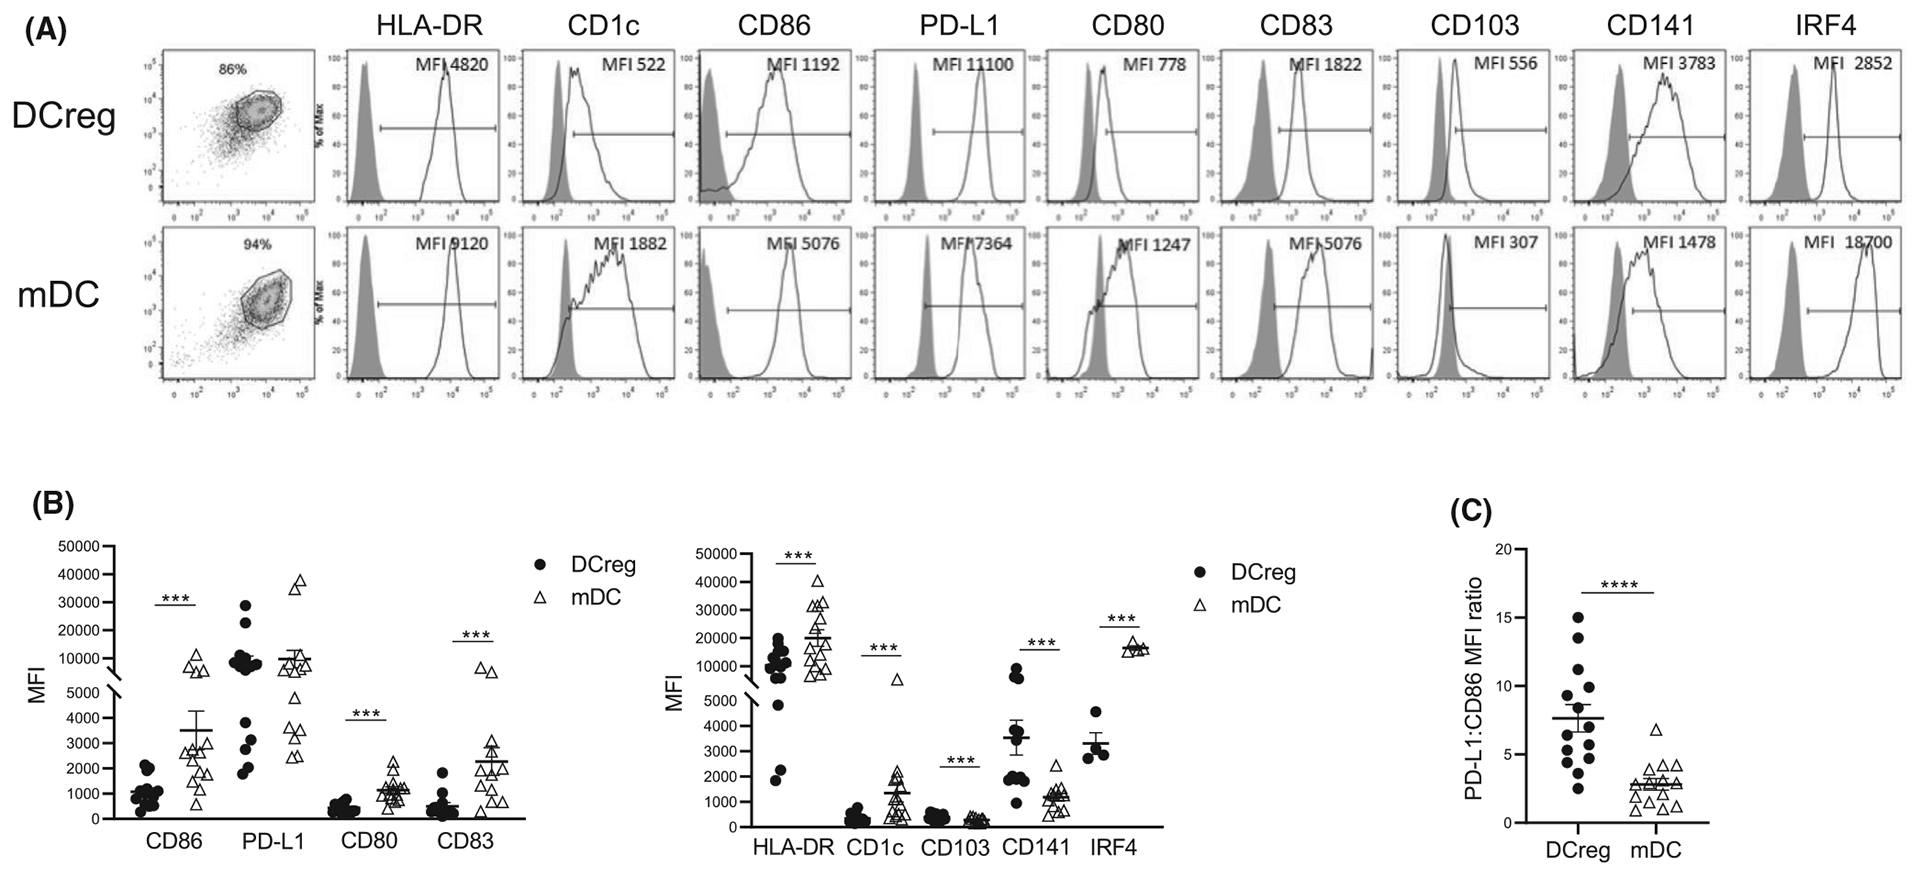
Phenotype of donor-derived DCreg. DCreg or for comparison, mature (m)DC (both n = 15) were stained for cell surface and intracellular molecules and analyzed by flow cytometry. (A) Representative histograms of molecules expressed by DCreg and mDC (open profiles) and isotype controls (gray profiles) (MFI, mean fluorescence intensity). (B) Overall intensity of expression of molecules (MFI) by DCreg (black circles) and mDC (open triangles). Wilcoxon matched-pair signed rank test or paired “t” test was used, accordingly to normality distribution. (C) PD-L1:CD86 ratios of DCreg and mDC. Mean values in B and C are indicated by horizontal lines. Paired “t” test was used for significance analysis. ***p < .001, ****p < .0001
3.4 |. GMP DCreg fail to induce allogeneic T cell proliferation
Ten prospective graft recipient and healthy control third party PBMC were cultured with GMP DCreg or mDC and T cell proliferation assessed (Figure 3A,B). Consistent with their phenotype, DCreg failed to or only minimally induced allogeneic CD4+ and CD8+ T cell proliferation compared with stimulatory mDC regardless of the number of HLA mismatches (ranging from 0 to >3).
FIGURE 3.

Allostimulatory function of donor-derived DCreg. Peripheral blood mononuclear cells (PBMC) isolated from either prospective living donor liver transplant recipients (n = 11) before donor DCreg infusion, or from unrelated third party healthy controls, were labeled with carboxyfluorescein diacetate succinimidyl ester (CSFE) and co-cultured with either corresponding prospective liver donor DCreg or control mature DC (mDC) at a 1:10 DC to PBMC ratio. Cells were harvested after 4 days and stained for CD4 and CD8 T cells. (A) Representative flow cytometry dot plots showing proliferation of CD4+ and CD8+T cells cultured alone or in the presence of DCreg or mDC determined by CSFE dilution. (B) Overall proliferative responses of CD4+ and CD8+ T cells of prospective DCreg recipients (n = 11) and third party healthy controls (n = 10) co-cultured in the absence (open circles) or presence of either DCreg (black circles) or mDC (open triangles). Mean values are denoted by horizontal lines. Paired “t” test was used for significance analysis. *p < .05, **p < .01
3.5 |. Cross-dressing of recipient cells after DCreg infusion
DCreg are thought to be short-lived following infusion into allogeneic recipients51 and may serve as a source of donor Ag for recipient quiescent APCs in lymphoid organs.52,53 Using a surrogate in vitro model, in which DCreg were “spiked” into normal allogeneic whole blood, we observed only a small proportion of surviving intact “donor” DCreg (identified by exclusionary MHC class I flow staining) after 18 h incubation. In addition, a small proportion of host DC, and to a lesser extent CD14+ monocytes, were cross-dressed with donor MHC class I (Figure 4A,B).
FIGURE 4.

Detection of intact DCreg and cross-dressed cells in allogeneic blood in vitro and in prospective LDLT recipients after DCreg infusion. (A,B) Blood was obtained from healthy allogeneic controls and “spiked” with HLA-mismatched DCreg. (A) Representative data from an HLA-A2+ DCreg donor and an HLA-A3+ “recipient.” After 18 h incubation, anti-HLA-A2 and anti-HLA-A3 mAbs were added and analysis of intact DCreg and cross-dressed DC and monocytes determined. (B) Overall data obtained with DCreg from four different individuals. (C,D) Whole blood was obtained from prospective living donor liver transplant recipients pre- and post-infusion of donor DCreg on day −7, and on day −3 to 0 (day of surgery) PBMC were analyzed for intact donor DCreg and cross-dressed DC by flow analysis of expression of donor/recipient HLA Ag. (C) Representative data from one prospective liver recipient. Left panels depict gating strategy for identification of DC (lineage−CD11c+HLA-DR+) and right panels, donor- (y-axis) and recipient-specific (x-axis) HLA-A or B class I expression. (D) Overall percentages and absolute counts of intact donor DCreg and cross-dressed DC (n = 9 patients)
To track donor-derived DCreg after their infusion into prospective LDLT recipients, both FC and ImS analyses were used. HLA-DR+CD11c+ cells were analyzed for expression of an appropriate, mismatched donor MHC class I allele to identify/differentiate recipient DC and donor DCreg (Figure 4C). Tracking was possible for nine donor-recipient pairs according to anti-HLA mAb availability. Using FC, intact donor DCreg were evident in eight of nine recipients immediately post-infusion (day −7). However, in all patients, these were no longer evident at later timepoints (day −3 to 0) (Figure 4D). On the other hand, cross-dressed host DC that had acquired donor MHC class I Ag were detected in blood early post-infusion on day −7 (six of nine recipients) and on day −3 to 0 (five of eight recipients), confirming the presence of circulating cross-dressed DCs at the time of surgery (Figure 4C,D).
Recipient DC cross-dressing was also visualized by ImS analysis of flow-sorted circulating DCs. Representative imaging in Figure 5A shows uniform expression of recipient HLAk by recipient DCs before donor DCreg infusion and subsequent punctate expression of acquired donor HLA on these cells to varying degrees 1 h post-infusion, and on day −3 to 0. The proportions of intact donor and cross-dressed DCs are shown in Figure 5B. Co-expression of donor- and recipient-specific HLA was also demonstrated on DC isolated from lymph nodes at the time of surgery (Figure 5A). Consistent with the FC data, no intact donor DCreg were detected in lymph nodes at the time of surgery (data not shown). In addition, ImS analysis revealed cross-dressed monocytes, mostly of the intermediate subset (CD14+CD16dim) (data not shown). Notably, PD-L1, expressed at comparatively high levels by the infused DCreg (Figure 2C), was detected on cross-dressed recipient DC coincident with donor MHC class I post-infusion and on day −3, suggesting acquisition of donor-derived PD-L1-and/or induction of PD-L1 expression on recipient DC following DCreg infusion (Figure 6A,B). Co-localization analysis of PD-L1 with recipient versus donor HLA mAb using the Similarity Bright Detail Score feature on IDEAS software, confirmed a significantly higher score for PD-L1/donor HLA compared to PD-L1/recipient HLA post-infusion, suggesting acquisition of both donor HLA and PD-L1 from the infused DCreg (Figure 6C).
FIGURE 5.

Advanced Image Stream analysis of cross-dressed cells in recipients of donor-derived DCreg. DC flow-sorted from blood of DCreg-infused prospective liver graft recipients before and after cell infusion were stained for donor- and recipient-specific HLA, HLA-DR (DR), CD11c, and PD-L1. Co-expression of donor- and recipient-specific HLA denotes cross-dressing of recipient DC with donor-specific Ag. (A) Representative images from one patient are shown: top row, donor DCreg product and below, recipient DC before DCreg infusion on day −7, at 1 h and day −3 post-infusion, and at day 0 (before graft implantation) in recipient whole blood or lymph nodes (day 0). (B,C) Overall incidences of intact donor DCreg and cross-dressed DC (n = 8 patients)
FIGURE 6.

PD-L1 expression and co-localization with donor/recipient HLA on cross-dressed cells. Advanced Image Stream analysis of PD-L1 expression on flow-sorted DC from prospective liver transplant recipients. (A) Representative images of circulating, cross-dressed cells from one patient obtained at different time points pre-and post-DCreg infusion depicting the expression of donor and recipient HLA, as well as PD-L1 and merged images of HLA/PD-L1. (B) Overall PD-L1 expression, determined by MFI (n = 8 cells) 1 h and day −3 post-infusion, on recipient DC and cross-dressed DC. (C) Overall co-localization of recipient or donor HLA and PD-L1 determined by bright detail similarity score (n = 8 cells) 1 h post-infusion and day −3 post-infusion on recipient DC and cross-dressed DC. *p < .05, ***p < .001, ****p < .0001
3.6 |. Donor-specific HLA and regulatory molecule expression by circulating sEVs after DCreg infusion
sEVs, including those released/acquired by DCs, may play an important role in regulation of immune responses, including alloimmunity and promotion of tolerance.21,54–56 Analysis of the protein content of sEVs (presumptive exosomes) isolated from plasma of four to nine DCreg recipients revealed significant increased levels of donor-specific HLA (Figure 7A) and PD-L1, CD73, CD39, but not CD86 (Figure 7B,C) on day −3 compared with pre-infusion levels, coinciding with cross-dressing of recipient DCs.
FIGURE 7.
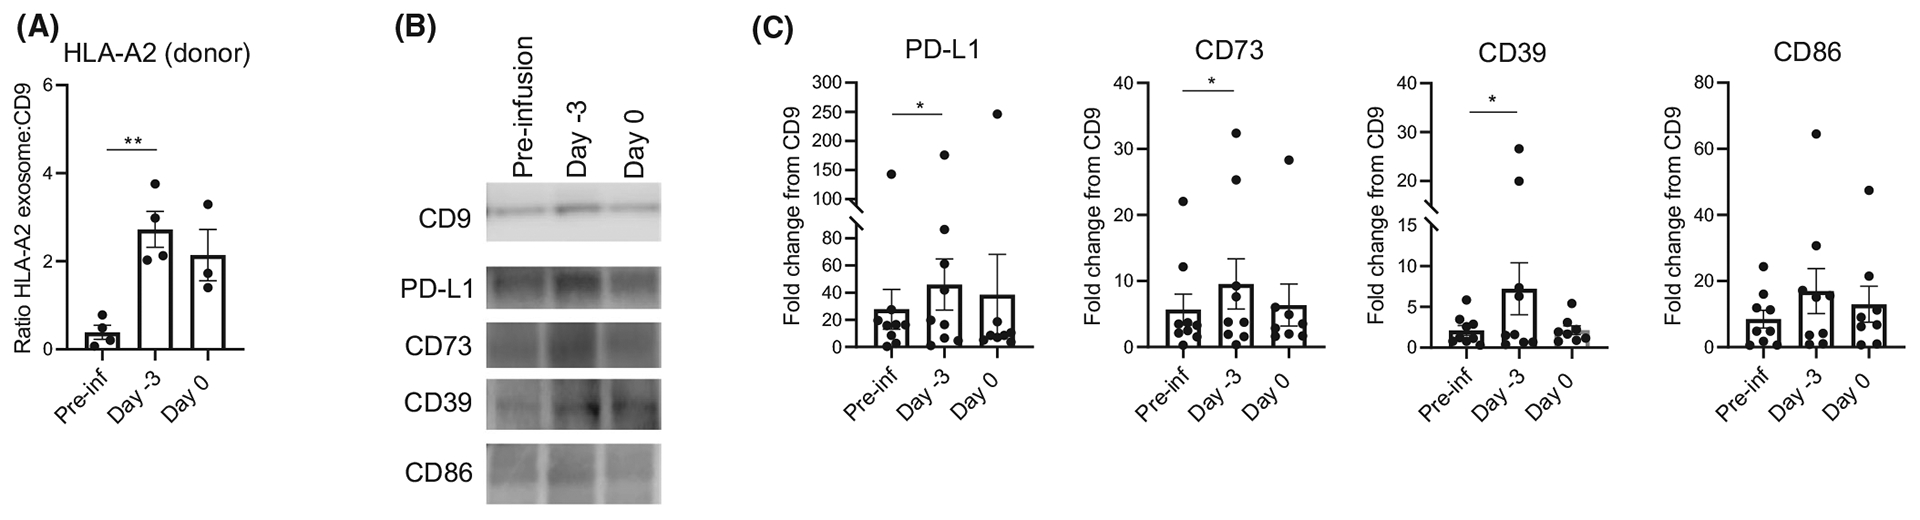
Levels of HLA-A2, CD9, PD-L1, CD39, CD73, and CD86 in circulating small extracellular vesicles (sEVs) following DCreg infusion in prospective living donor liver graft recipients. (A) Overall data from n = 4 patients showing the ratio of donor-specific HLA-A2 exosomes to CD9 calculated by # of labeled fluorescent particles of HLA-A2/total # of particles/ml divided by # of labeled fluorescent particles of CD9/ total # of particles/ml. (B) Representative Western Blot analysis of isolated sEVs obtained before (pre-infusion; Pre-inf) and after DCreg infusion at day −3 and 0. (C) Overall data from n = 9 patients showing fold change relative to CD9 expression. Each point represents one individual. Paired “t” test was used for significance analysis. *p < .05, **p < .01
3.7 |. Changes in circulating T cells after DCreg infusion
We also ascertained whether DCreg infusion impacted prospective graft recipients’ T cells. First, we implemented viSNE representation using t-distributed Stochastic Neighbor Embedding (tSNE) platform by Cytobank57 as an unsupervised approach, to assess phenotypic changes in CD8+ T cells after DCreg infusion and before transplant compared to their own pre-infusion phenotypes. The consensus CD8+ T cell map generated from a representative patient and overlaid with staining for memory/naïve cells (defined by CD62L/CD45RO), T-bet, Eomes, PD-1, TIM3, and CTLA4 is shown in Figure 8A. This analysis revealed decreased T-bet and Eomes within effector and central memory CD8+ T cell clusters following DCreg infusion. Supervised gating and 2D analysis confirmed that DCreg infusion triggered a decrease in levels of T-bet+/Eomes+CD8+ T cells compared to pre-DCreg infusion levels (Figure 8B). This T cell subset constitutes the most potent type-1 effectors, and has been associated with CMV infection control58 and potent donor-specific alloimmunity during ACR.59 These T-bet+/Eomes+ CD8+ T cells displayed a trend toward increased central memory and decreased TEMRA, as well as an overall upregulation of PD-1 (data not shown). Conversely, there was a significant increase in the incidence of T-bet−/Eomes−CD8+ T cells (Figure 8B) enriched in naïve phenotypes and elevated TIM3 expression (data not shown). In addition, CD8+ T cells displayed increased dual PD-1+/TIM3+ expression, a potential indication of exhaustion after DCreg infusion (Figure 8C). Taken together, these results suggest that DCreg infusion signals CD8+ T cells to undergo phenotypic changes characteristic of dampened type-1 immune reactivity. In addition, we have applied the same analyses to the CD4+ T cell compartment. Our results show minimal/no influence of DCreg infusion on expression of the transcription factors Eomes and T-bet, or of PD-1 and TIM3 by circulating CD4+ T cells (Figure S2).
FIGURE 8.

Circulating CD8+ T cell subsets before and after DCreg infusion. Prospective liver graft recipient whole blood (n = 15) was stained for different markers to characterize CD8 memory subsets (EM, effector memory CD45RO+CD62L−; CM, central memory CD45RO+CD62L+; naïve CD45RO−CD62L+; TemRA, terminally differentiated effector memory CD45RO−CD62L−) and for markers of activation/exhaustion/regulation: T-bet, Eomes, TIM3, PD-1, and CTLA4. (A) viSNE of CD8+ T cell changes in phenotype before and after DCreg infusion generated from a representative prospective graft recipient and depicting different cell markers. (B) Representative dot plots of T-bet and Eomes expression by CD8+ T cells and overall (n = 15) % of T-bet−Eomes− and T-bet+Eomes+ subsets. (C) Representative dot plots of PD-1 and TIM3 expression on CD8+ T cells and overall (n = 15) % of PD-1+TIM3+ cells. Paired “t” test was used for significance analysis. *p < .05
3.8 |. DCreg infusion elevates Treg/T-bet+Eomes+ CD8+ T ratios
It is well accepted that alloreactive CD8+ T cell responses are modulated by Treg and that alterations in these subsets may exaggerate or diminish alloimmunity.60,61 Therefore, we monitored circulating Tregs (CD4+CD25+Foxp3+CD127−) in peripheral blood before and 3–7 days after DCreg infusion. First, we applied viSNE as described above to identify Tregs (Figure 9A) followed by a supervised gating strategy depicted in Figure 9B. Treg levels were significantly elevated post-DCreg infusion, with absolute numbers showing an upward trend (Figure 9C). Treg markers (i.e., CD39, TIGIT, Helios) and memory subset distribution were unchanged (data not shown). Consequently, the increased proportion of Treg detected after DCreg infusion resulted in significantly increased Treg: T-bet+Eomes+ CD8+ T cell ratios, based on % and absolute counts (Figure 9D). These data suggest that DCreg infusion may induce tighter regulation of memory CD8+ T cells, potentially favorable to allo-immune constraint at the time of transplant.
FIGURE 9.

Circulating Treg and T cell subset ratios before and after DCreg infusion. Prospective liver graft recipients’ whole blood samples were stained for different markers to characterize and quantify CD4+Treg (CD4+CD25+Foxp3+CD127−). (A) viSNE plots of CD4+ Treg before and after DCreg infusion generated from a representative prospective graft recipient and depicting different cell markers. (B) Gating strategy for identification of Treg, as well as dot plots generated pre- and post- DCreg infusion for one representative patient. (C) Overall data (n = 15 patients) showing % (top panel) and absolute numbers (bottom panel) of Treg. Paired “t” test (top panel) and Wilcoxon matched-pair signed rank test (bottom panel) were used for significance analysis. (D) Ratios calculated between the % (top panel) and absolute counts (bottom panel) of Treg and CD8+ T-bet+Eomes+ cells. Wilcoxon matched-pair signed rank test was used for significance analysis. *p < .05, **p < .01
4 |. DISCUSSION
DCreg are important candidates for adoptive cell therapy in organ transplantation.15,62 While an early phase (safety) trial of autologous DCreg given 1 day before living donor renal transplantation, has been undertaken at the University of Nantes (NCT 02252055) as part of The ONE study,11 there are no reports of donor-derived DCreg infusion in transplant recipients. In addition to differences in their source (autologous vs. donor), timing of their infusion and type of transplant, there are also differences in DCreg manufacturing and the cell dose infused between the studies in Nantes and those performed here (1 × 10⁶/kg vs. 1.6–8.7 × 10⁶/kg body weight, respectively).
As reported recently for GMP-compliant DCreg generated in Nantes from healthy subjects or patients with end-stage renal disease using different culture conditions (GM-CSF alone, with no maturation inhibitor),16 the healthy donor monocyte-derived DCreg in this study exhibited a tolerogenic profile, resistance to maturation and potential to modulate alloreactive T cell responses. The 15 individual GMP DCreg products exhibited excellent yield, viability and purity, with minimal lymphocyte contamination. They were distinguished from stimulatory DCs generated concomitantly from the same donors by comparatively low IRF4 expression, high PD-L1: CD86 expression (mean MFI ratio 4.2), and very high IL-10:IL-12 production (mean ratio 41.0) following CD40 ligation. As we have shown,39 blocking of the PD-L1-PD1 pathway can partially restore T cell stimulatory activity to similarly generated DCregs, whereas IL-10-modulated human DCreg have potent immunosuppressive properties.63 In all but one instance (in which a second donor leukapheresis could not be performed), adequate numbers of viable DCreg were generated (in 13/15 instances from a single leukapheresis product) to meet a target cell dose range (2.5–10 × 106 cells/kg) based on that of similarly generated donor-derived DCreg that proved safe and effective in NHP renal transplantation.31 This success rate may constitute a possible advantage over other types and sources of regulatory cells (e.g., autologous Tregs) with which achieving adequate numbers over several weeks expansion may be a limiting factor for some patients.11
Using discriminatory donor HLA staining, intact donor-derived DCreg with preserved regulatory phenotype were detected in the circulation shortly after their infusion, but not at later time points. Failure to demonstrate persistence of donor DCreg in the circulation is consistent with the short-lived survival of donor DCreg in mouse organ transplantation51 that may reflect their killing by NK cells.64 In two living-donor kidney transplant patients infused with [111In]-radiolabeled, lineage-related, donor-derived regulatory macrophages (Mregs), 1 week before transplant,13 the Mregs were trapped initially in the pulmonary vasculature (with no evidence of any consequent perfusion defect). By 2.5 h post-infusion, they were found in the circulation and by 4.5 h, had begun to accumulate in liver and spleen. One day after their administration, the majority of Mregs could no longer be detected in blood.
In the present study, as soon as 1 h after DCreg infusion, acquisition of donor MHC class I Ag (cross-dressing) by host DCs was observed. ImS analysis further revealed coincident expression of acquired donor HLA and immunoregulatory PD-L1. These findings resemble recently reported transient cross-dressing of circulating host APCs (dendritic cells and monocytes) with donor HLA from graft-derived sEVs (that inhibit allogeneic T cell responses) and its co-localization with PD-L1 early after liver (but not kidney) transplantation.65 Under these latter circumstances, the donor HLA and PD-L1 acquired by host APCs may be derived either from donor leukocytes or liver graft parenchymal cells. It is therefore of interest that, as in the present study, cross-dressing of circulating APCs following liver transplantation, that peaks on day 1, is transient, despite the continued presence of the donor liver, within which, as discussed65 cross-dressing might persist for prolonged periods. Recipient APCs cross-dressed with exogenous donor-derived sEVs bearing peptide:MHC on the vesicle surface can present pre-formed peptide:MHC-I and peptide:MHC-II complexes via the semi-direct pathway66,67 to directly alloreactive CD8+ T cells and CD4+ T cells, respectively, without further Ag processing and permitting regulation of alloreactive CD8+ T cells by CD4+ cell subsets.
Since we detected increased donor-specific HLA, PD-L1 and other immunoregulatory molecules (CD39 and CD73) in plasma sEVs (presumed exosomes) at the same time as host APC cross-dressing (i.e., early after DCreg infusion), it appears that immune regulatory molecules were acquired from the infused DCregs. sEVs, especially exosomes, including those released/acquired by DCs, can play important roles in regulation of alloimmunity22,23 and the promotion of tolerance.21,54–56,68 Indeed, in liver transplant patients, circulating graft-derived exosomes bearing PD-L1 suppress alloreactive T cell proliferation,65 whereas myeloma-derived PD-L1-expressing exosomes depress CD8+ T function and promote tumor growth.21 Moreover, mouse spontaneous liver allograft acceptance is associated with acquisition of donor MHC class I by host DCs that express high PD-L1, suppress anti-donor T cell reactivity and promote senescence of graft-infiltrating T cells.21 There is also evidence that the activity of CD39 and CD73 that were also elevated in circulating exosomes after DCreg infusion, promotes an anti-inflammatory/immunosuppressed environment69 and that extracellular adenosine conditions DCs for their tolerogenic functions.70
Mechanisms by which adoptively transferred DCreg modulate host T cell reactivity in vivo continue to be elucidated71 and include production of IL-10 that drives Tregs,72,73 expression of immune modulatory/inhibitory molecules such as PD-L1/2, CTLA-4, and ILT-3/4,74 and promotion of elevated levels of circulating lactate, that suppresses T cell glycolysis and immune reactivity.75 The ability of DCregs to modulate anti-donor T cell reactivity in prospective liver transplant recipients (the subjects of the present study) must be viewed in the context of liver disease-induced defects/alterations in T cell functions76–80 that may underlie their inferior proliferative responses to allostimulation compared with those of healthy third party T cells (Figure 3). Although in the current study, DCreg did not cause any overall changes in host CD4+ and CD8+ T absolute cell numbers nor in CD4+ T cell phenotype between the time of their infusion and that of graft implantation, T-bethiEomeshi memory CD8+ T cells declined and regulatory (CD25hi CD127−Foxp3+): effector T cell (T-bethi Eomeshi) ratios increased significantly. Thus, donor-derived DCreg infusion appears to induce changes in host APCs, memory CD8+ T cells and Treg that may be conducive to modulated immune reactivity at the time of transplant. We will report subsequently on clinical outcomes and post-transplant immunological monitoring in the LDLT recipients given donor DCreg in the current study, and whether this approach to immune cell therapy results in enhanced success of early IS drug withdrawal compared with currently recognized levels in adult liver transplantation.81,82
Supplementary Material
ACKNOWLEDGMENTS
The work was supported by funding from the University of Pittsburgh Medical Center Immune Transplant and Therapy Center. LT is in receipt of a NIAID institutional T32 AI 74490 research training fellowship and a Physician-Scientist Institutional Award from the Burroughs Wellcome Fund held by the University of Pittsburgh. AWT is supported by NIH grants R01 AI 118777, U19 AI 131453, and U01 AI 136779. HD is supported by the National Science Foundation of China (81800664), Natural Science Foundation of Hunan Province of China (2019JJ50842), and Huxiang Young Talents of Hunan Province (2019RS2013). This work also benefited from IMAGE STREAMX MARK II funded by NIH 1S10OD019942-01 (PI: L. Borghesi). We thank Drs. Adrian Morelli and Simon Watkins for their discussion and advice.
Abbreviations:
- DC(s)
dendritic cell(s)
- DCreg(s)
regulatory dendritic cells(s)
- GMP
good manufacturing practice
- LDLT
living donor liver transplantation
- sEV
small extracellular vesicle
Footnotes
DISCLOSURE
The authors of this manuscript have no conflicts of interest to disclose as described by the American Journal of Transplantation.
DATA AVAILABILITY STATEMENT
The data that support the findings of this study are available from the corresponding author upon reasonable request.
SUPPORTING INFORMATION
Additional supporting information may be found online in the Supporting Information section.
REFERENCES
- 1.Kang SM, Tang Q, Bluestone JA. CD4+CD25+ regulatory T cells in transplantation: progress, challenges and prospects. Am J Transplant. 2007;7(6):1457–1463. [DOI] [PubMed] [Google Scholar]
- 2.Morelli AE, Thomson AW. Tolerogenic dendritic cells and the quest for transplant tolerance. Nat Rev Immunol. 2007;7(8):610–621. [DOI] [PubMed] [Google Scholar]
- 3.Wood KJ, Bushell A, Hester J. Regulatory immune cells in transplantation. Nat Rev Immunol. 2012;12(6):417–430. [DOI] [PubMed] [Google Scholar]
- 4.Hutchinson JA, Riquelme P, Geissler EK. Human regulatory macrophages as a cell-based medicinal product. Curr Opin Organ Transplant. 2012;17(1):48–54. [DOI] [PubMed] [Google Scholar]
- 5.Safinia N, Scotta C, Vaikunthanathan T, Lechler RI, Lombardi G. Regulatory T cells: serious contenders in the promise for immunological tolerance in transplantation. Front Immunol. 2015;6:438. [DOI] [PMC free article] [PubMed] [Google Scholar]
- 6.Tang Q, Vincenti F. Transplant trials with Tregs: perils and promises. J Clin Invest. 2017;127(7):2505–2512. [DOI] [PMC free article] [PubMed] [Google Scholar]
- 7.Todo S, Yamashita K, Goto R, et al. A pilot study of operational tolerance with a regulatory T-cell-based cell therapy in living donor liver transplantation. Hepatology. 2016;64(2):632–643. [DOI] [PubMed] [Google Scholar]
- 8.Chandran S, Tang Q, Sarwal M, et al. Polyclonal regulatory T cell therapy for control of inflammation in kidney transplants. Am J Transplant. 2017;17(11):2945–2954. [DOI] [PMC free article] [PubMed] [Google Scholar]
- 9.Mathew JM, H.-Voss J, LeFever A, et al. A Phase I clinical trial with ex vivo expanded recipient regulatory t cells in living donor kidney transplants. Sci Rep. 2018;8(1):7428. [DOI] [PMC free article] [PubMed] [Google Scholar]
- 10.Sánchez-Fueyo A, Whitehouse G, Grageda N, et al. Applicability, safety, and biological activity of regulatory T cell therapy in liver transplantation. Am J Transplant. 2020;20(4):1125–1136. [DOI] [PMC free article] [PubMed] [Google Scholar]
- 11.Sawitzki B, Harden PN, Reinke P, et al. Regulatory cell therapy in kidney transplantation (The ONE Study): a harmonised design and analysis of seven non-randomised, single-arm, phase 1/2A trials. Lancet. 2020;395(10237):1627–1639. [DOI] [PMC free article] [PubMed] [Google Scholar]
- 12.Riquelme P, Haarer J, Kammler A, et al. TIGIT(+) iTregs elicited by human regulatory macrophages control T cell immunity. Nat Commun. 2018;9(1):2858. [DOI] [PMC free article] [PubMed] [Google Scholar]
- 13.Hutchinson JA, Riquelme P, Sawitzki B, et al. Cutting edge: immunological consequences and trafficking of human regulatory macrophages administered to renal transplant recipients. J Immunol. 2011;187(5):2072–2078. [DOI] [PubMed] [Google Scholar]
- 14.Thomson AW, Humar A, Lakkis FG, Metes DM. Regulatory dendritic cells for promotion of liver transplant operational tolerance: rationale for a clinical trial and accompanying mechanistic studies. Hum Immunol. 2018;79(5):314–321. [DOI] [PMC free article] [PubMed] [Google Scholar]
- 15.Moreau A, Alliot-Licht B, Cuturi MC, Blancho G. Tolerogenic dendritic cell therapy in organ transplantation. Transplant Int. 2017;30(8):754–764. [DOI] [PubMed] [Google Scholar]
- 16.Bouchet-Delbos L, Even A, Varey E, et al. Preclinical assessment of autologous tolerogenic dendritic cells from end-stage renal disease patients. Transplantation. 2020;In press. [DOI] [PubMed] [Google Scholar]
- 17.Ohnmacht C, Pullner A, King SBS, et al. Constitutive ablation of dendritic cells breaks self-tolerance of CD4 T cells and results in spontaneous fatal autoimmunity. J Exp Med. 2009;206(3):549–559. [DOI] [PMC free article] [PubMed] [Google Scholar]
- 18.Iberg CA, Hawiger D. Natural and induced tolerogenic dendritic cells. J Immunol. 2020;204(4):733–744. [DOI] [PMC free article] [PubMed] [Google Scholar]
- 19.Levitsky J, Mathew JM, Abecassis M, et al. Systemic immunoregulatory and proteogenomic effects of tacrolimus to sirolimus conversion in liver transplant recipients. Hepatology. 2013;57(1):239–248. [DOI] [PMC free article] [PubMed] [Google Scholar]
- 20.Levitsky J, Burrell BE, Kanaparthi S, et al. Immunosuppression withdrawal in liver transplant recipients on sirolimus. Hepatology. 2020;72(2):569–583. [DOI] [PMC free article] [PubMed] [Google Scholar]
- 21.Ono Y, Perez-Gutierrez A, Nakao T, et al. Graft-infiltrating PD-L1(hi) cross-dressed dendritic cells regulate antidonor T cell responses in mouse liver transplant tolerance. Hepatology. 2018;67(4):1499–1515. [DOI] [PMC free article] [PubMed] [Google Scholar]
- 22.Liu Q, Rojas-Canales DM, Divito SJ, et al. Donor dendritic cell-derived exosomes promote allograft-targeting immune response. J Clin Invest. 2016;126(8):2805–2820. [DOI] [PMC free article] [PubMed] [Google Scholar]
- 23.Marino J, Babiker-Mohamed MH, Crosby-Bertorini P, et al. Donor exosomes rather than passenger leukocytes initiate alloreactive T cell responses after transplantation. Sci Immunol. 2016;1(1):aaf8759. [DOI] [PMC free article] [PubMed] [Google Scholar]
- 24.Takenaka MC, Quintana FJ. Tolerogenic dendritic cells. Semin Immunopathol. 2017;39(2):113–120. [DOI] [PMC free article] [PubMed] [Google Scholar]
- 25.Hilkens CM, Isaacs JD, Thomson AW. Development of dendritic cell-based immunotherapy for autoimmunity. Int Rev Immunol. 2010;29(2):156–183. [DOI] [PubMed] [Google Scholar]
- 26.Ochando J, Ordikhani F, Jordan S, Boros P, Thomson AW. Tolerogenic dendritic cells in organ transplantation. Transplant Int. 2020;33(2):113–127. [DOI] [PMC free article] [PubMed] [Google Scholar]
- 27.Fu F, Li Y, Qian S, et al. Costimulatory molecule-deficient dendritic cell progenitors (MHC class II+, CD80dim, CD86−) prolong cardiac allograft survival in nonimmunosuppressed recipients. Transplantation. 1996;62(5):659–665. [DOI] [PMC free article] [PubMed] [Google Scholar]
- 28.Lutz M, Suri R, Niimi M, et al. Immature dendritic cells generated with low doses of GM-CSF in the absence of IL-4 are maturation resistant and prolong allograft survival in vivo. Eur J Immunol. 2000;30(7):1813–1822. [DOI] [PubMed] [Google Scholar]
- 29.Beriou G, Peche H, Guillonneau C, Merieau E, Cuturi MC. Donor-specific allograft tolerance by administration of recipient-derived immature dendritic cells and suboptimal immunosuppression. Transplantation. 2005;79(8):969–972. [DOI] [PubMed] [Google Scholar]
- 30.Hill M, Thebault P, Segovia M, et al. Cell therapy with autologous tolerogenic dendritic cells induces allograft tolerance through interferon-gamma and epstein-barr virus-induced gene 3. Am J Transplant. 2011;11(10):2036–2045. [DOI] [PubMed] [Google Scholar]
- 31.Ezzelarab MB, Zahorchak AF, Lu L, et al. Regulatory dendritic cell infusion prolongs kidney allograft survival in nonhuman primates. Am J Transplant. 2013;13(8):1989–2005. [DOI] [PMC free article] [PubMed] [Google Scholar]
- 32.Ezzelarab MB, Raich-Regue D, Lu L, et al. Renal allograft survival in nonhuman primates infused with donor antigen-pulsed autologous regulatory dendritic cells. Am J Transplant. 2017;17(6):1476–1489. [DOI] [PMC free article] [PubMed] [Google Scholar]
- 33.Dhodapkar MV, Steinman RM, Krasovsky J, Munz C, Bhardwaj N. Antigen-specific inhibition of effector T cell function in humans after injection of immature dendritic cells. J Exp Med. 2001;193(2):233–238. [DOI] [PMC free article] [PubMed] [Google Scholar]
- 34.Dhodapkar MV, Steinman RM. Antigen-bearing immature dendritic cells induce peptide-specific CD8(+) regulatory T cells in vivo in humans. Blood. 2002;100(1):174–177. [DOI] [PubMed] [Google Scholar]
- 35.Giannoukakis N, Phillips B, Finegold D, Harnaha J, Trucco M. Phase I (safety) study of autologous tolerogenic dendritic cells in type 1 diabetic patients. Diabetes Care. 2011;34(9):2026–2032. [DOI] [PMC free article] [PubMed] [Google Scholar]
- 36.Bell GM, Anderson AE, Diboll J, et al. Autologous tolerogenic dendritic cells for rheumatoid and inflammatory arthritis. Ann Rheum Dis. 2017;76(1):227–234. [DOI] [PMC free article] [PubMed] [Google Scholar]
- 37.Jauregui-Amezaga A, Cabezón R, Ramírez-Morros A, et al. Intraperitoneal administration of autologous tolerogenic dendritic cells for refractory Crohn’s Disease: a phase I study. J Crohns Colitis. 2015;9(12):1071–1078. [DOI] [PubMed] [Google Scholar]
- 38.Zubizarreta I, Flórez-Grau G, Vila G, et al. Immune tolerance in multiple sclerosis and neuromyelitis optica with peptide-loaded tolerogenic dendritic cells in a phase 1b trial. Proc Natl Acad Sci USA. 2019;116(17):8463–8470. [DOI] [PMC free article] [PubMed] [Google Scholar]
- 39.Zahorchak AF, Macedo C, Hamm DE, Butterfield LH, Metes DM, Thomson AW. High PD-L1/CD86 MFI ratio and IL-10 secretion characterize human regulatory dendritic cells generated for clinical testing in organ transplantation. Cell Immunol. 2018;323:9–18. [DOI] [PMC free article] [PubMed] [Google Scholar]
- 40.Penna G, Adorini L. 1 Alpha, 25-dihydroxyvitamin D3 inhibits differentiation, maturation, activation, and survival of dendritic cells leading to impaired alloreactive T cell activation. J Immunol. 2000;164(5):2405–2411. [DOI] [PubMed] [Google Scholar]
- 41.Steinbrink K, Wolfl M, Jonuleit H, Knop J, Enk AH. Induction of tolerance by IL-10-treated dendritic cells. J Immunol. 1997;159(10):4772–4780. [PubMed] [Google Scholar]
- 42.Hackstein H, Thomson AW. Dendritic cells: emerging pharmacological targets of immunosuppressive drugs. Nat Rev Immunol. 2004;4(1):24–35. [DOI] [PubMed] [Google Scholar]
- 43.Watson AR, Dai H, Zheng Y, et al. mTORC2 deficiency alters the metabolic profile of conventional dendritic cells. Front Immunol. 2019;10:1451. [DOI] [PMC free article] [PubMed] [Google Scholar]
- 44.Thane KE, Davis AM, Hoffman AM. Improved methods for fluorescent labeling and detection of single extracellular vesicles using nanoparticle tracking analysis. Sci Rep. 2019;9(1):12295. [DOI] [PMC free article] [PubMed] [Google Scholar]
- 45.Gunasekaran M, Sharma M, Hachem R, Bremner R, Smith MA, Mohanakumar T. Circulating exosomes with distinct properties during chronic lung allograft rejection. J Immunol. 2018;200(8):2535–2541. [DOI] [PMC free article] [PubMed] [Google Scholar]
- 46.Gunasekaran M, Bansal S, Ravichandran R, et al. Respiratory viral infection in lung transplantation induces exosomes that trigger chronic rejection. J Heart Lung Transplant. 2020;39(4):379–388. [DOI] [PMC free article] [PubMed] [Google Scholar]
- 47.Bailey-Bucktrout S, Martinez-Llordella M, Zhou X, et al. Self-antigen-driven activation induces instability of regulatory T cells during an inflammatory autoimmune response. Immunity. 2013;39(5):949–962. [DOI] [PMC free article] [PubMed] [Google Scholar]
- 48.Cernadas M, Lu J, Watts G, Brenner MB. CD1a expression defines an interleukin-12 producing population of human dendritic cells. Clin Exp Immunol. 2009;155(3):523–533. [DOI] [PMC free article] [PubMed] [Google Scholar]
- 49.Malaguarnera L, Marsullo A, Zorena K, Musumeci G, Di Rosa M. Vitamin D3 regulates LAMP3 expression in monocyte derived dendritic cells. Cell Immunol. 2017;311:13–21. [DOI] [PubMed] [Google Scholar]
- 50.Petersen B, Wolf M, Austermann J, et al. The alarmin Mrp8/14 as regulator of the adaptive immune response during allergic contact dermatitis. EMBO J. 2013;32(1):100–111. [DOI] [PMC free article] [PubMed] [Google Scholar]
- 51.Divito SJ, Wang Z, Shufesky WJ, et al. Endogenous dendritic cells mediate the effects of intravenously injected therapeutic immunosuppressive dendritic cells in transplantation. Blood. 2010;116(15):2694–2705. [DOI] [PMC free article] [PubMed] [Google Scholar]
- 52.Morelli AE, Larregina AT, Shufesky WJ, et al. Internalization of circulating apoptotic cells by splenic marginal zone dendritic cells: dependence on complement receptors and effect on cytokine production. Blood. 2003;101(2):611–620. [DOI] [PubMed] [Google Scholar]
- 53.Wang Z, Shufesky WJ, Montecalvo A, Divito SJ, Larregina AT, Morelli AE. In situ-targeting of dendritic cells with donor-derived apoptotic cells restrains indirect allorecognition and ameliorates allograft vasculopathy. PLoS One. 2009;4(3):e4940. [DOI] [PMC free article] [PubMed] [Google Scholar]
- 54.Peche H, Heslan M, Usal C, Amigorena S, Cuturi MC. Presentation of donor major histocompatibility complex antigens by bone marrow dendritic cell-derived exosomes modulates allograft rejection. Transplantation. 2003;76(10):1503–1510. [DOI] [PubMed] [Google Scholar]
- 55.Robbins PD, Morelli AE. Regulation of immune responses by extracellular vesicles. Nat Rev Immunol. 2014;14(3):195–208. [DOI] [PMC free article] [PubMed] [Google Scholar]
- 56.Chen G, Huang AC, Zhang W, et al. Exosomal PD-L1 contributes to immunosuppression and is associated with anti-PD-1 response. Nature. 2018;560(7718):382–386. [DOI] [PMC free article] [PubMed] [Google Scholar]
- 57.Kotecha N, Krutzik PO, Irish JM. Web-based analysis and publication of flow cytometry experiments. Curr Protoc Cytom. 2010;10 (Unit 10.17). 10.1002/0471142956.cy1017s53 [DOI] [PMC free article] [PubMed] [Google Scholar]
- 58.Popescu I, Pipeling MR, Shah PD, Orens JB, McDyer JF. T-bet: Eomes balance, effector function, and proliferation of cytomegalovirus-specific CD8+ T cells during primary infection differentiates the capacity for durable immune control. J Immunol. 2014;193(11): 5709–5722. [DOI] [PMC free article] [PubMed] [Google Scholar]
- 59.Perez-Gutierrez A, Metes DM, Lu L, Hariharan S, Thomson AW, Ezzelarab MB. Characterization of eomesodermin and T-bet expression by allostimulated CD8(+) T cells of healthy volunteers and kidney transplant patients in relation to graft outcome. Clin Exp Immunol. 2018;194(2):259–272. [DOI] [PMC free article] [PubMed] [Google Scholar]
- 60.Kreijveld E, Koenen HJ, van Cranenbroek B, van Rijssen E, Joosten I, Hilbrands LB. Immunological monitoring of renal transplant recipients to predict acute allograft rejection following the discontinuation of tacrolimus. PLoS One. 2008;3(7):e2711. [DOI] [PMC free article] [PubMed] [Google Scholar]
- 61.Macedo C, Walters JT, Orkis EA, et al. Long-term effects of alemtuzumab on regulatory and memory T-cell subsets in kidney transplantation. Transplantation. 2012;93(8):813–821. [DOI] [PMC free article] [PubMed] [Google Scholar]
- 62.Thomson AW, Metes DM, Ezzelarab MB, Raich-Regue D. Regulatory dendritic cells for human organ transplantation. Transplant Rev. 2019;33(3):130–136. [DOI] [PMC free article] [PubMed] [Google Scholar]
- 63.Kryczanowsky F, Raker V, Graulich E, Domogalla MP, Steinbrink K. IL-10-modulated human dendritic cells for clinical use: identification of a stable and migratory subset with improved tolerogenic activity. J Immunol. 2016;197(9):3607–3617. [DOI] [PubMed] [Google Scholar]
- 64.Yu G, Xu X, Vu MD, Kilpatrick ED, Li XC. NK cells promote transplant tolerance by killing donor antigen-presenting cells. J Exp Med. 2006;203(8):1851–1858. [DOI] [PMC free article] [PubMed] [Google Scholar]
- 65.Mastoridis S, Londono MC, Kurt A, et al. Impact of donor extracellular vesicle release on recipient cell “cross-dressing” following clinical liver and kidney transplantation. Am J Transplant. 2020. 10.1111/ajt.16123;In press [DOI] [PubMed] [Google Scholar]
- 66.Herrera OB, Golshayan D, Tibbott R, et al. A novel pathway of alloantigen presentation by dendritic cells. J Immunol. 2004;173(8):4828–4837. [DOI] [PubMed] [Google Scholar]
- 67.Zeng F, Morelli AE. Extracellular vesicle-mediated MHC cross-dressing in immune homeostasis, transplantation, infectious diseases, and cancer. Semin Immunopathol. 2018;40(5):477–490. [DOI] [PMC free article] [PubMed] [Google Scholar]
- 68.Bracamonte-Baran W, Florentin J, Zhou Y, et al. Modification of host dendritic cells by microchimerism-derived extracellular vesicles generates split tolerance. Proc Natl Acad Sci USA. 2017;114(5):1099–1104. [DOI] [PMC free article] [PubMed] [Google Scholar]
- 69.Antonioli L, Pacher P, Vizi ES, Hasko G. CD39 and CD73 in immunity and inflammation. Trends Mol Med. 2013;19(6):355–367. [DOI] [PMC free article] [PubMed] [Google Scholar]
- 70.Silva-Vilches C, Ring S, Mahnke K. ATP and its metabolite adenosine as regulators of dendritic cell activity. Front Immunol. 2018;9: 2581. [DOI] [PMC free article] [PubMed] [Google Scholar]
- 71.Ochando J, Ordikhani F, Jordan S, Boros P, Thomson AW. Tolerogenic dendritic cells in organ transplantation. Transpl Int. 2020;33:113–127. [DOI] [PMC free article] [PubMed] [Google Scholar]
- 72.Gregori S, Tomasoni D, Pacciani V, et al. Differentiation of type 1 T regulatory cells (Tr1) by tolerogenic DC-10 requires the IL-10-dependent ILT4/HLA-G pathway. Blood. 2010;116(6): 935–944. [DOI] [PubMed] [Google Scholar]
- 73.Comi M, Amodio G, Gregori S. Interleukin-10-producing DC-10 is a unique tool to promote tolerance via antigen-specific T regulatory type 1 cells. Front Immunol. 2018;9:682. [DOI] [PMC free article] [PubMed] [Google Scholar]
- 74.Domogalla MP, Rostan PV, Raker VK, Steinbrink K. Tolerance through education: how tolerogenic dendritic cells shape immunity. Front Immunol. 2017;8:1764. [DOI] [PMC free article] [PubMed] [Google Scholar]
- 75.Marin E, Bouchet-Delbos L, Renoult O, et al. Human tolerogenic dendritic cells regulate immune responses through lactate synthesis. Cell Metab. 2019;30(6):1075–1090 e1078. [DOI] [PubMed] [Google Scholar]
- 76.Schirren CA, Jung MC, Zachoval R, et al. Analysis of T cell activation pathways in patients with liver cirrhosis, impaired delayed hypersensitivity and other T cell-dependent functions. Clin Exp Immunol. 1997;108(1):144–150. [DOI] [PMC free article] [PubMed] [Google Scholar]
- 77.Pasala S, Barr T, Messaoudi I. Impact of alcohol abuse on the adaptive immune system. Alcohol Res. 2015;37(2):185–197. [PMC free article] [PubMed] [Google Scholar]
- 78.Antonucci L, Porcu C, Timperi E, Santini SJ, Iannucci G, Balsano C. Circulating neutrophils of nonalcoholic steatohepatitis patients show an activated phenotype and suppress T lymphocytes activity. J Immunol Res. 2020;2020:4570219. [DOI] [PMC free article] [PubMed] [Google Scholar]
- 79.Zhao F, Korangy F, Greten TF. Cellular immune suppressor mechanisms in patients with hepatocellular carcinoma. Dig Dis. 2012;30(5):477–482. [DOI] [PMC free article] [PubMed] [Google Scholar]
- 80.Hartling HJ, Ballegaard VC, Nielsen NS, Gaardbo JC, Nielsen SD. Immune regulation in chronic hepatitis C virus infection. Scand J Gastroenterol. 2016;51(11):1387–1397. [DOI] [PubMed] [Google Scholar]
- 81.Shaked A, DesMarais MR, Kopetskie H, et al. Outcomes of immunosuppression minimization and withdrawal early after liver transplantation. Am J Transplant. 2019;19(5):1397–1409. [DOI] [PMC free article] [PubMed] [Google Scholar]
- 82.Thomson AW, Vionnet J, Sanchez-Fueyo A. Understanding liver graft tolerance and failure. Nat Rev Gastroenterol Hepatol. 2020;17(12):719–739. [DOI] [PubMed] [Google Scholar]
Associated Data
This section collects any data citations, data availability statements, or supplementary materials included in this article.