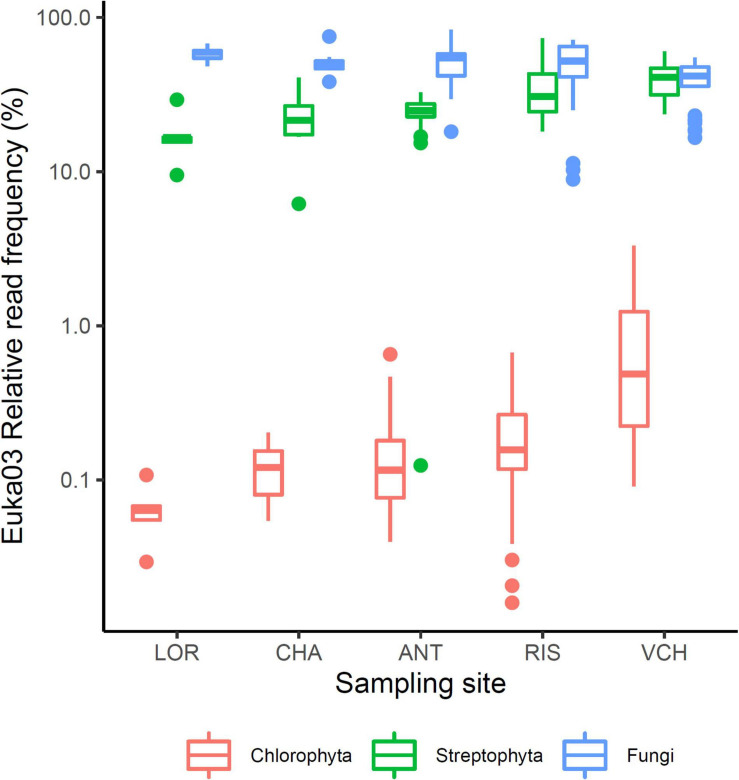
FIGURE 2.
Relative frequencies of three eukaryotic clades; Fungi, Streptophyta, and Chlorophyta, among the sampling sites. The lower and upper limits of the boxes correspond to the first and third quartile, respectively, while the bold center line marks the median. The whiskers delineate the confidence interval defined as 1.5 times the difference between the first and third quartile. Outlier PCRs ranging outside of that interval are marked with dots.

