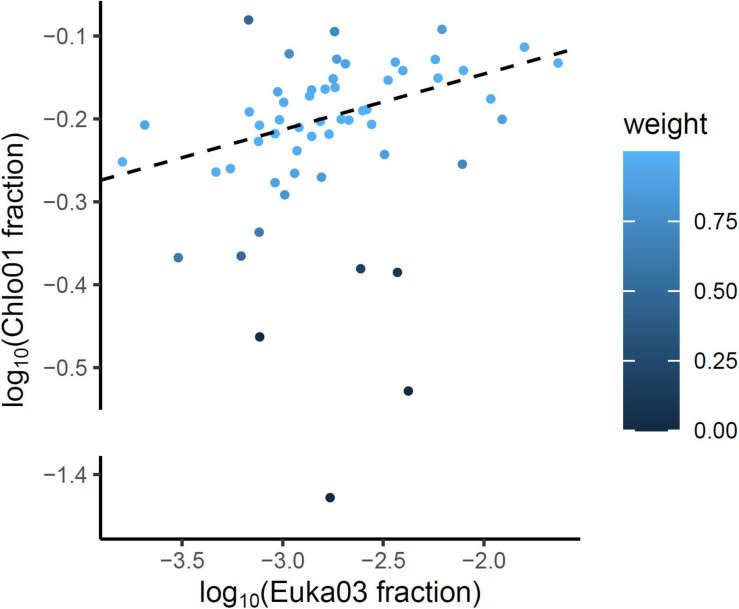
FIGURE 3.
On a logarithmic scale, the relative frequencies of Chlorophyta reads estimated by the two markers Chlo01 and Euka03 are correlated. The linear model (dotted line) was estimated using an iteratively reweighted least squares procedure (IRLS) to underweight the influence of the few outliers PCRs. The blue scale indicates the weight associated to each PCR after the convergence of the algorithm.

