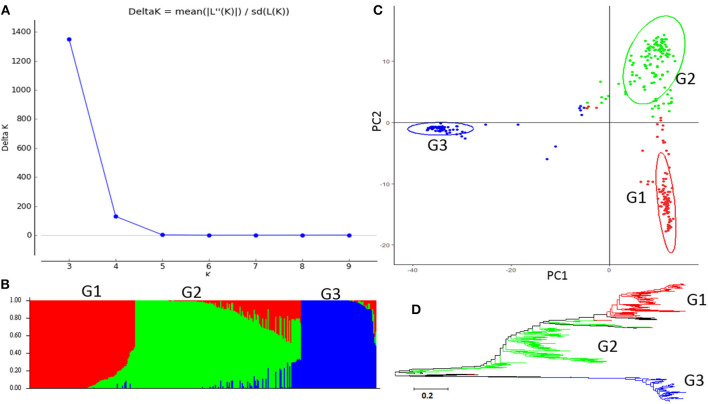
Figure 2.
Model-based populations in the association panel consisted of 315 USDA common bean germplasm accessions. (A) Delta K values for different numbers of populations (K) assumed in the analysis completed with the STRUCTURE Version 2.3.4 software. (B) Classification of 315 common bean accessions into three populations using the STRUCTURE Version 2.3.4, where the numbers on the y-axis show the subgroup membership and the x-axis shows the different accessions. The distribution of accessions in different populations is indicated by the color coding (Cluster 1, G1, is red; Cluster 2, G2, is green; and Cluster 3, G3, is blue). (C) Graphical plot of the principal component analysis (PCA) of the 315 common bean accessions. The horizontal and vertical axes are the first and second principal components, and the variances explained by each component are noted. (D) Maximum Likelihood (ML) tree of the 315 common bean accessions drawn in MEGA 7. The color code for each population is consistent in the (B–D).

