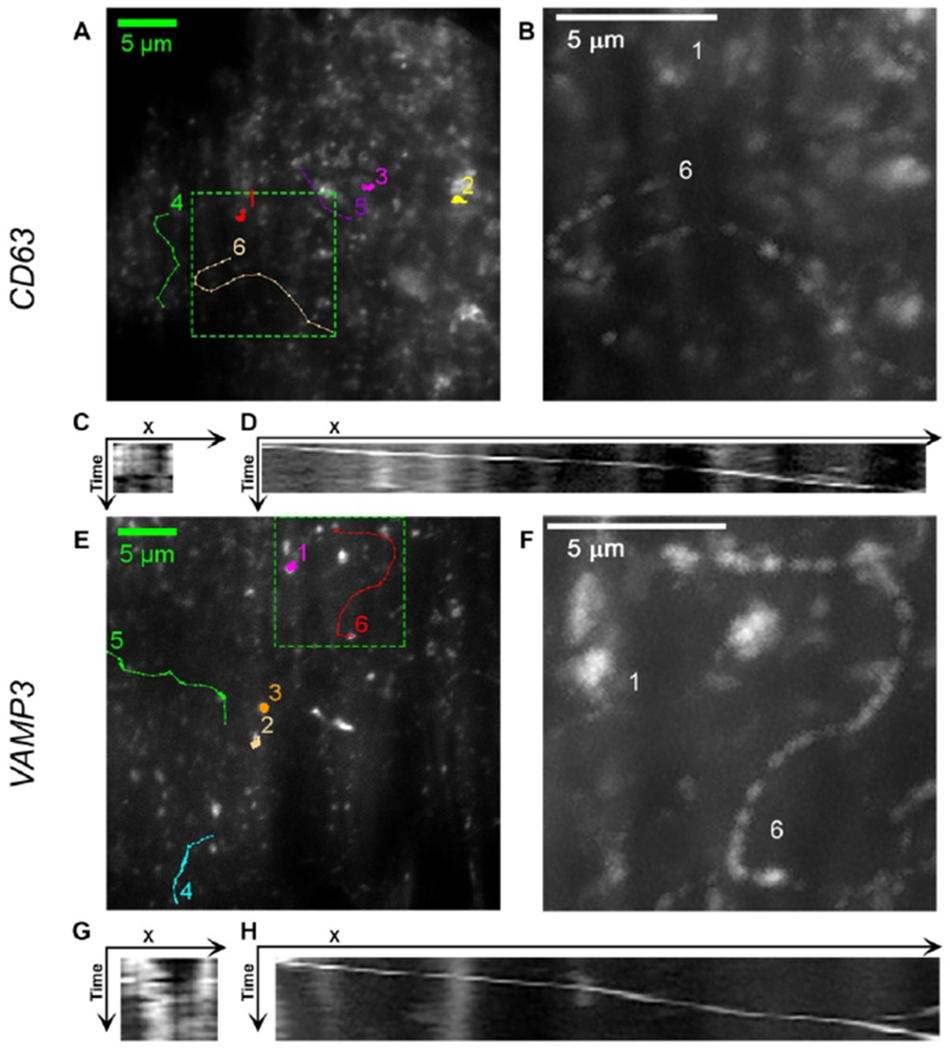
Figure 1.

Images of EGFP-CD63 (A, B, C, D) and EGFP-VAMP3 (E, F, G, H) labeled vesicles. (A, E) Trajectories of EGFP-CD63 and EGFP-VAMP3 labeled vesicles. (B, F) Maxium intensity Z-projection of the tracks 1 and 6 in the region surrounded by dashed line rectangle in A) and E). (C, G) Kymograph of the movements of vesicle in track 1 in A) and E). (D, H) Kymograph of the movements of vesicle in track 6 in A) and E). Track 1, 2, and 3 are the trajectories of vesicles in non-directional movement. Track 4, 5, and 6 are the trajectories of vesicles in directional movement. Kymographs were generated using Multi Kymograph plugin in ImageJ.
