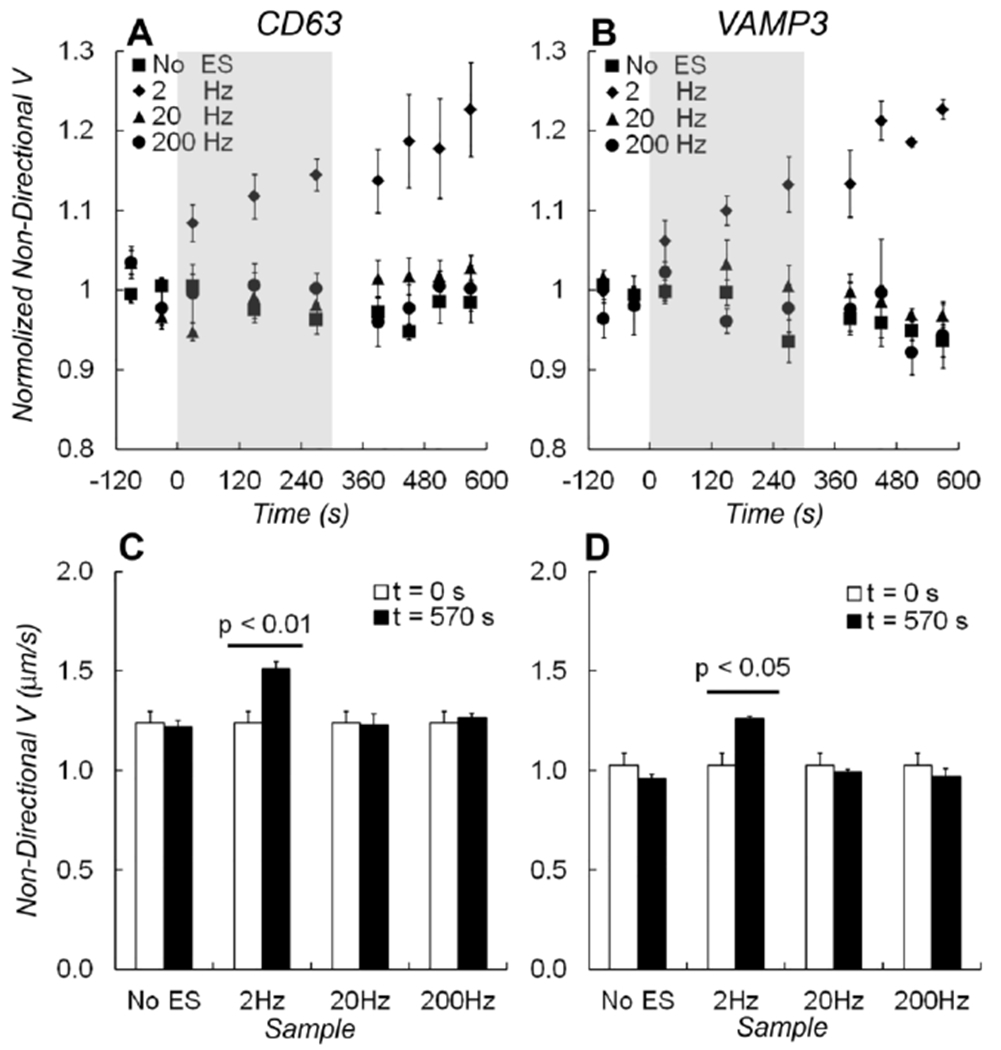
Figure 2.

Average speeds of non-directional movement Vnon-d. The normalized speeds for non-directional movement of A) EGFP-CD63 and B) EGFP-VAMP3 labeled vesicles during the experiment timeline. Electrical stimulations were applied at 2 Hz (diamonds), 20 Hz (triangles), 200 Hz frequency (circles), or without stimulation (squares). The grey shades indicated the time when electrical stimulation was applied. C) A bar graph shows changes of Vnon-d measured before (at t = 0 s) and after (at t = 570 s) electrical stimulations from EGFP-CD63 labeled vesicles. D) A bar graph shows changes in Vnon-d measured from EGFP-VAMP3 labeled vesicles. One-way ANOVA test showed that the average speed of non-directional vesicles changed significantly after 2 Hz electrical stimulation (p < 0.01 in EGFP-CD63 data and p < 0.05 in EGFP-VAMP3 data). The changes in speed caused by electrical stimulation at 20 Hz and 200 Hz frequency, or without stimulations were insignificant.
