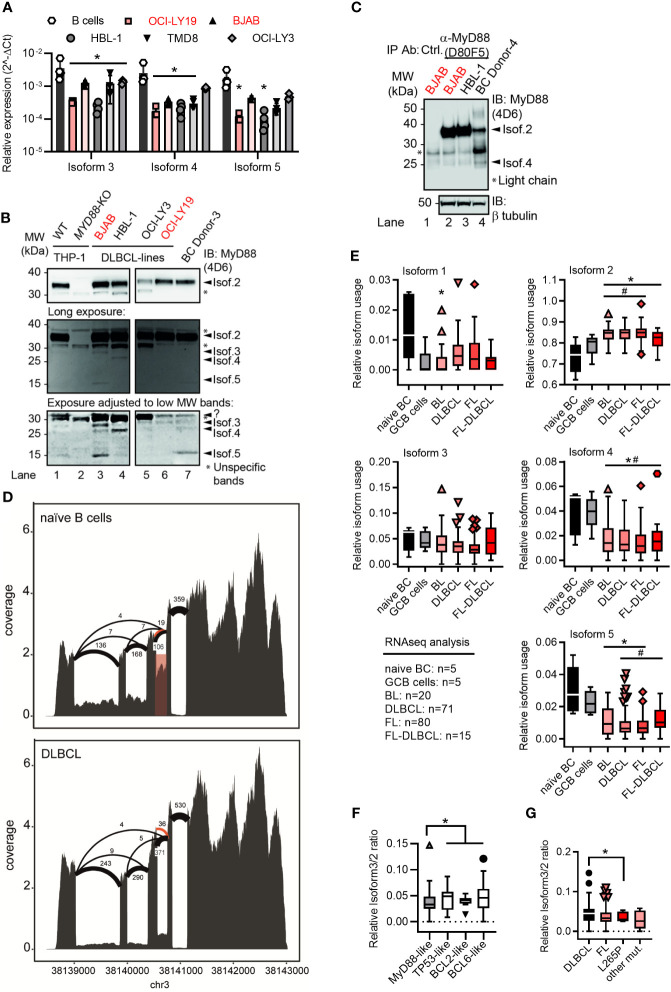
Figure 2.
Lymphoma cell lines and primary tumor samples show a preference for the canonical MYD88 isoform. (A) RT-qPCR analysis of isoforms 3-5 in primary B cells or lymphoma cell lines (n=3-4; red GCB, black ABC). (B) Immunoblot from THP-1 myeloid cells, B lymphoma cell lines and primary B cells (n=3). (C) Immunoblot from pulldown of MyD88 isoforms using the antibody D80F5 against the TIR domain (exon 4). (D) Sashimi plots with mean read numbers supporting the splice junctions from naïve B cells (n=5) and DLBCL samples (n=83). The red shaded box shows intron retention and orange arcs represent an alternative donor splice site from isoforms 6 and 7. (E) RNAseq analysis of relative isoform usage from untransformed B cells or lymphoma samples (n=as indicated). Isoform 2 expressed as 1-(sum of all others). Other isoforms used: number of unique splice junctions divided by number of reads at the respective splice site (see Methods). (F, G) Ratios of isoform 3 (MYD88s) to isoform 2 in different DLBCL sub-clusters (F) and in dependence of MYD88 mutations (G). (F) MyD88-like n=24, BCL2-like n=9, BCL6-like n=16 and TP53-like n=19. (G) MyD88 L265P mutated samples (n=5) and other mutants (n=6) compared to respective MyD88 wildtype lymphomas. (A, E–G) represent combined data (mean+SD, or Tukey box and whiskers) from ‘n’ biological replicates (each dot represents one replicate). In B one representative of ‘n’ technical replicates is shown. * or # = p<0.05 according to two-way ANOVA (A), Mann-Whitney (E, comparison to naïve B cells (*) or to GCB cells (#)), or Wilcoxon (F, G).

