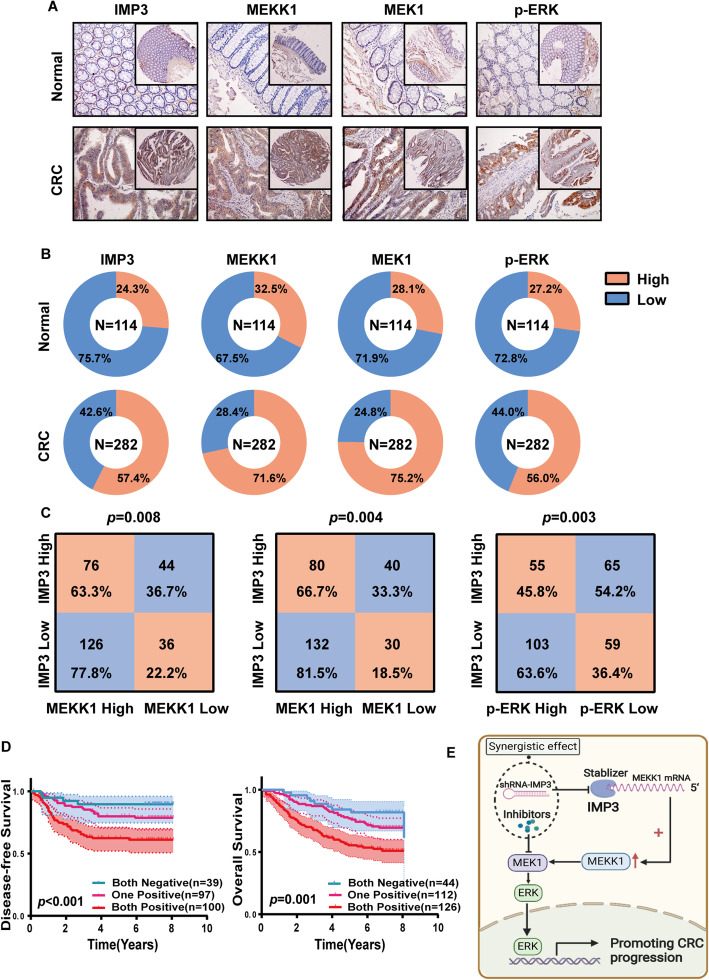
Fig. 6.
Expression of IMP3 and MEKK1/MEK/ERK in clinical CRC samples. (A) Representative images and the number of IMP3, MEKK1, MEK1 and p-ERK detected by IHC in CRC tissue microarrays. (B) IMP3, MEKK1, MEK1 and p-ERK expression in adjacent normal colon mucosa (n = 114, up panel) and colorectal cancer tissue (n = 282, lower panel). (C)Correlation of IMP3 expression with MEKK1, MEK1 and p-ERK. (D) KaplaneMeier analyses for the FUSCC dataset. Patients were divided into three groups based on the expression of IMP3 and MEKK1 (negative or positive). Both positive groups had the poorest prognosis with the lowest DFS and OS. (E)Schematic model showing the role of IMP3 in regulating MEKK1/MEK1/ERK Signaling Pathway in the Progression of Colorectal Cancer

