Fig. 2.
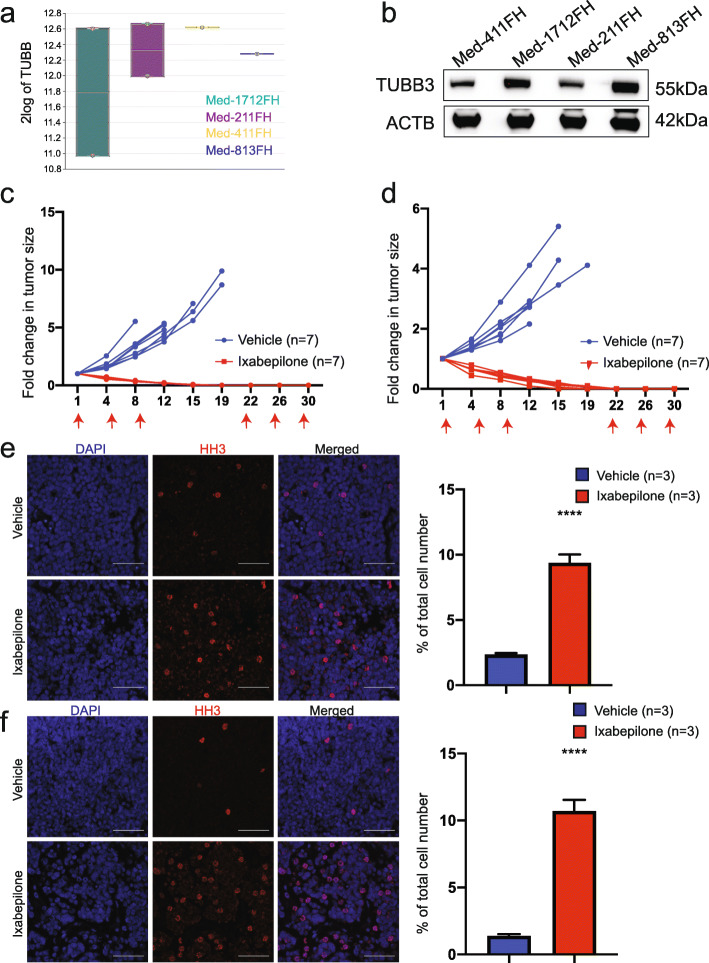
Ixabepilone causes regression of MYC-amplified Gp3 MB. a Relative mRNA expression of TUBB in Med-1712FH, Med-211FH, Med-411FH and Med-813FH PDX as compared to other paediatric brain tumours (PDX, matching human primary brain tumours and cell lines) using the R2 Genomics Analysis and Visualization Platform (http://r2.amc.nl). b Immunoblot analysis of TUBB3 and ACTB levels in Med-411FH, Med-1712FH, Med-211FH and Med-813FH PDX. Blots were scanned using BioRad ChemiDoc MP Imager and cropped using Adobe Illustrator. Fold change in tumour volume following treatment with ixabepilone or vehicle in mice bearing two Grp3 PDX models, c Med-211FH and d Med-411FH subcutaneous tumours. Tumour measurements were compared between vehicle and drug treatments using linear mixed models analysis in R. Treatment days are indicated by a red arrow on each graph. Representative images of HH3 immunostaining as a marker of mitosis respectively in Med-211FH (e, left) and Med-411FH (f, left) subcutaneous tumours following vehicle (top panel) and ixabepilone (bottom panel). Scale bar 20 μm. Quantitative analysis of HH3 staining in Med-211FH (e, right) and Med-411FH (f, right) tumours. Percentage of tumour cells staining positive were quantified for vehicle (n = 3) and drug-treated tumours (n = 3) using Image J software. Data are presented as the mean ± SEM. Statistical evaluation was performed using a Holm-Sidak corrected multiple t test with statistically significant differences indicated (*P < 0.05, **** P < 0.0001)

