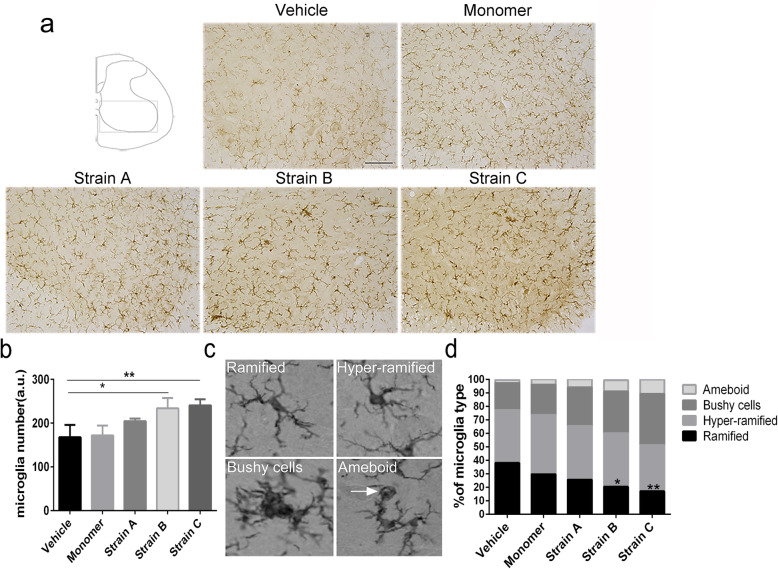
Fig. 6.
Microglia-associated neuroinflammation in the spinal cord in BAC-α-syn-GFP mice. a Immunostaining of Iba1 showed the distribution of microglia in the lumbar spinal cord. Scale bar, 100 μm. b Numbers of microglia in the ventral horn of the lumbar spinal cord after injection of different α-syn fibrils. One-way ANOVA, n = 3, *P < 0.05, **P = 0.0034 with Tukey’s multiple comparison tests. c Morphology of Iba1-positive cells revealed ramified (surveillance microglia), hyper-ramified (intermediate) microglia, and un-ramified (bushy or amoeboid) microglia. d Percentage of Iba1-positive cells according to the morphology in the lumbar spinal cord after IM injection in each group (n = 3, *P < 0.05, **P < 0.01). The total numbers of the microglia at stages 2–4 increased in Strain B and Strain C groups (n = 3, *P < 0.05), analysed by one-way ANOVA with Tukey’s multiple comparison tests. Each bar shows mean ± SD

