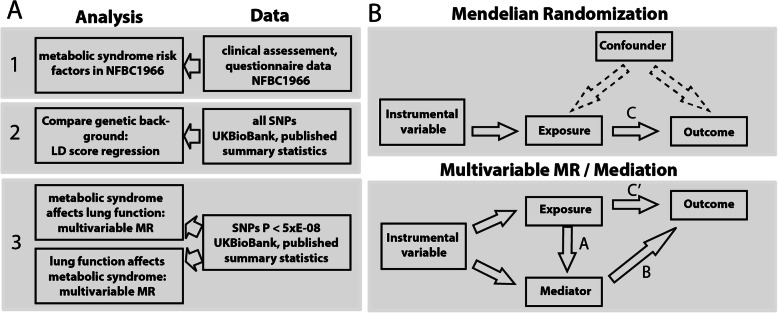
Fig. 1.
Flow chart of study design. A Cardio-metabolic traits were body mass index (BMI), type 2 diabetes (T2D), C-reactive protein (CRP), lipoprotein (HDL-C), low-density lipoprotein (LDL-C), total cholesterol (TC), triglycerides (TG), systolic blood pressure (SBP), diastolic blood pressure (DBP), pulse pressure (PP) and coronary artery disease (CAD). Tested lung function traits were first second forced expiratory capacity (FEV1), forced vital capacity (FVC) and a ratio of both FEV1/FVC. B Graphical relationship diagrams in a classical MR and mediation analysis. Upper panel gives overview of MR analysis, indicating the use of genetic instruments instead of the actual exposure. Arrow labelled with C in upper panel refers to the causal estimate as well as the C-path in mediation analysis setting. Lower panel gives an overview of the mediation analysis following Baron-Kenney approach. For mediation analysis in this study, we subtracted C’ path from C-path to get effect sizes for mediation

