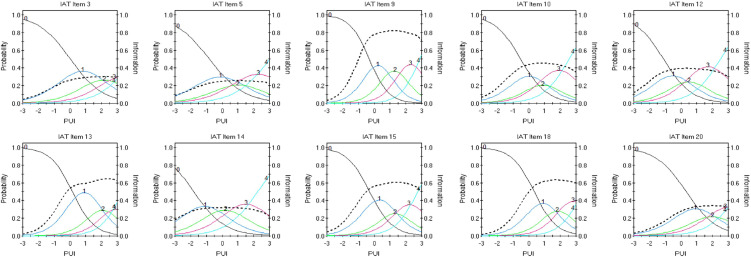
Figure 1. Combined Option Response Functions and Item Information Functions for the 10 Items of the IAT-10 in the Potential Problematic Users of the Internet SA Sample (N = 564).
Note. The horizontal axis is the latent trait [θ] of Problematic Usage of the Internet (PUI) measured in standard deviation units (M = 0, SD = 1). The scale on the left vertical axis is the probability of endorsing a response category at various points of the PUI continuum. The scale on the right axis is information provided by the item at various points of the PUI continuum. The option response functions indicate how well different item response categories discriminate at different levels of PUI. The colored trace lines represent probability thresholds for endorsing the response category at different levels of θ. 0 = Rarely; 1 = Occasionally; 2 = Frequently; 3 = Often; 4 = Always; ..... = Information. See the online article for the color version of this figure.

