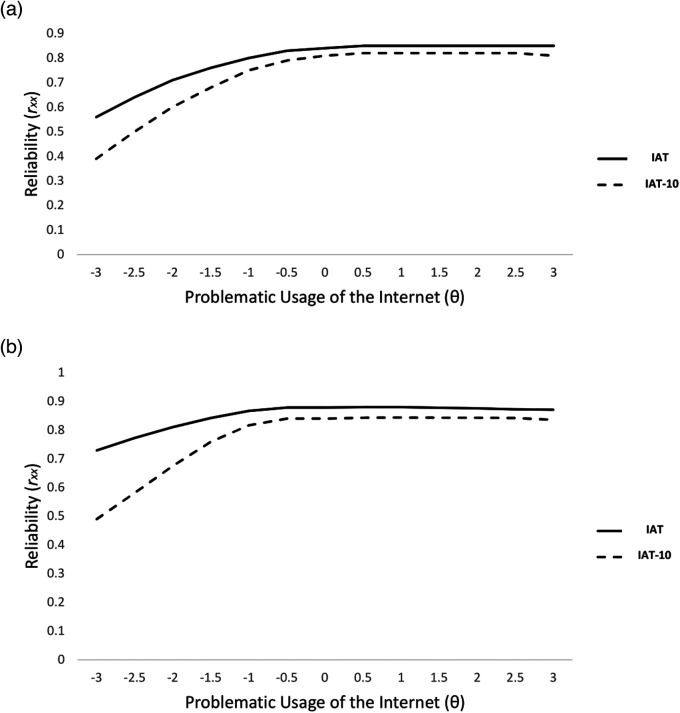
Figure 2. Line Graphs Comparing the Reliability (r xx) of the Full-Length Internet Addiction Test (IAT) to the 10-Item Internet Addiction Test (IAT-10) Across the Problematic Usage of the Internet Latent Trait Continuum (θ) in the (a) SA (N = 564) and (b) USA (N = 252) Samples of Potential Problematic Users of the Internet.
Note. rxx = 1–(SEE2) or rxx = 1–(1/I). SEE = Standard Error of the Estimate. I = Information. θ expressed in standardized units, with a mean of zero and a standard deviation of one.

