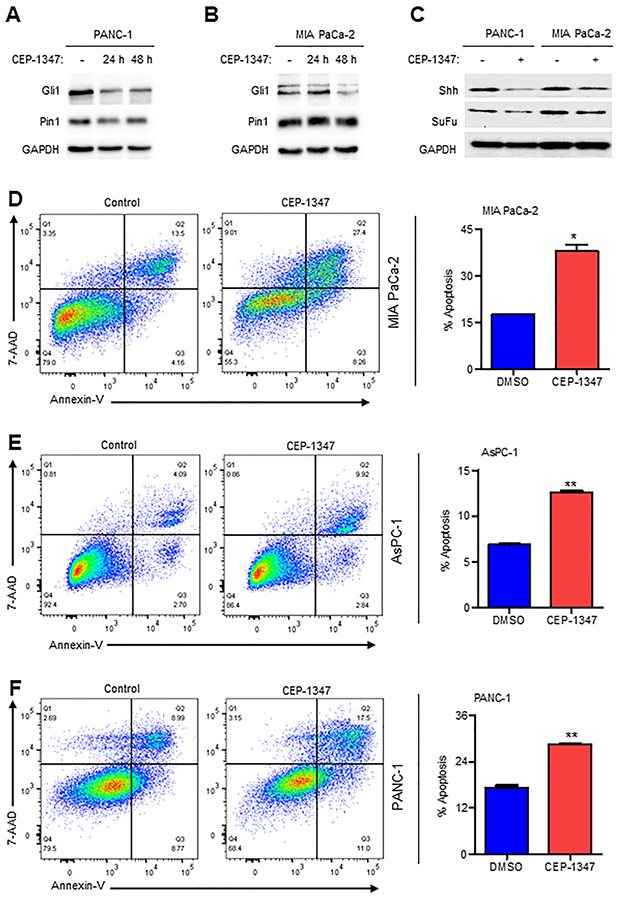
Figure 5. The pharmacological inhibitor of MLK3, CEP-1347, downregulates GLI1, and its downstream targets and induces cell death.
(A-B) PANC-1 and MIA PaCa-2 cells were treated either with 500 nM of CEP-1347 for 24 or 48 hours or with vehicle (DMSO), and cell extracts were blotted either with GLI1 or PIN1 antibodies. (C) These cell extracts (from a and b) were also blotted with GLI1 downstream target antibodies, SHH and SUFU (D-F) The PANC-1 and MIA PaCa-2 and AsPC-1 cells were treated with 500 nM of CEP-1347 or vehicle control (DMSO) for 24 hours, and apoptosis was assessed with Annexin V-FITC staining. The Pseudo color plots (left) represent 7AAD vs. Annexin V expression, gated on singlets, and bar graphs (right) show quantification of total apoptosis. Data are presented as mean ± SEM, and two groups were compared by two-tailed Student t-test (N=2, *p<0.05 and **p<0.001).

