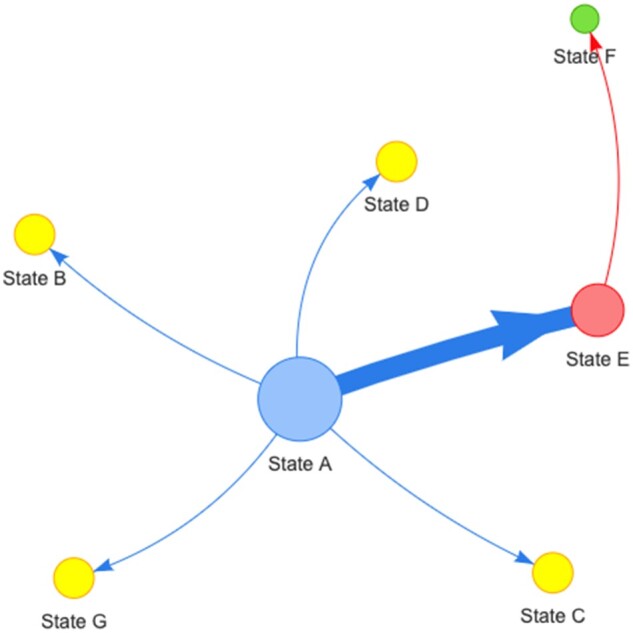
Fig. 1.

Example of a generic pathogen transmission network based on geographic location (“states” as in character and/or geographic). Sizes of nodes are scaled by the metric selected by the user (i.e. betweenness, closeness, degree or source hub ratio). The arrows reflect directionality of transition between states. The thickness of the lines and arrows represents the frequency of transitions (thicker arrows reflect more transitions). In the current implementation, colors of nodes are randomly assigned to a metric score and associated with nodes
