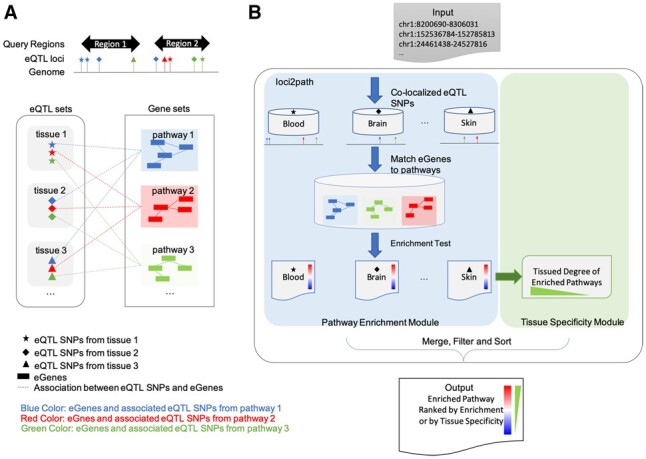
Fig 1.

Overview of loci2path. (A) Illustration of the loci2path software. We use shapes to mark tissue or cell types, and colors to differentiate pathways. In the eQTL box, eQTL locations from different tissues are shown in different shapes. In the pathway box, genes from different pathways are shown in different colors. Dash lines represent the association between eQTL and eGenes. (B) illustration of loci2path workflow. (Color version of this figure is available at Bioinformatics online.)
