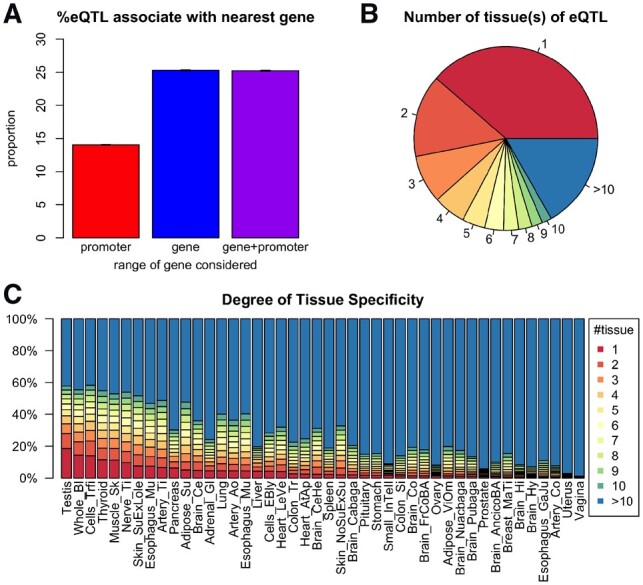
Fig 2.

Summary of eQTLs and tissue specificity. (A) The percentage of eQTLs whose eGene is its nearest gene. The three bars represent three different ways to define the nearest gene. For an eQTL-eGene pair, three types of distance are considered: (1) distance to the gene promoter (defined as −2000 ∼ +200 bp of the transcription start site (TSS); (2) distance to the gene body [from TSS to the transcription end site (TES)]; (3) distance to promoter and gene body (from 2000 bp upstream of TSS to the TES). (B) The breakdown of all eQTLs according to the number of tissue(s) in which the eQTL is found to be significant. The percentages are: 1: 38.7%; 2: 14.5%; 3: 8.4%; 4: 5.7%; 5: 4.0%; 6: 3.3%; 7: 2.6%; 8: 2.3%; 9: 1.9%; 10: 1.7%; >10: 16.8%. (C) Distribution of degree of tissue specificity (DTS) of eQTLs within each tissue. Each bar shows the composition of eQTLs with different DTS. Tissues are ordered with an increasing average DTS
