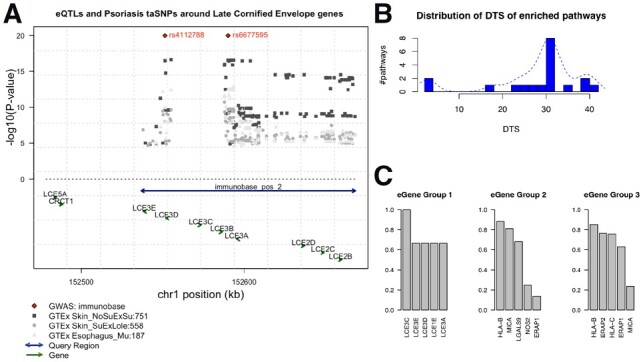
Fig 4.

Psoriasis-related functional groups revealed by tissue specificity. (A) Genome browser view of the LCE cluster 3 gene locus as an example to illustrate the spatial relationships among query regions, eQTLs, eGenes in the genome. Arrows located toward the bottom indicate genes, with arrows showing the direction of its transcription. Double-arrow line indicates an input query region. Diamond dots at the top represent GWAS loci associated with psoriasis, according to the immunoBase. Gray dots are GTEx eQTLs, with height denotes the P-value in negative log scale. Different shapes and shades represent different tissue origin. Numbers next to the tissue name abbreviation indicate the number of eQTLs associated with the eGene. (B) Distribution of DTS for enriched pathways using psoriasis risk regions as query. The x-axis is the DTS values for an enriched pathway. The y-axis is the average number of pathways with the corresponding DTS score. For the same pathway enriched in different tissues, the DTS are averaged. We observe three clusters of DTS, which are in concordance with the pathway clusters found in the eQTL enrichment heatmap in Figure 3. (C) Most frequent eGenes from the three groups of enriched pathways using psoriasis risk regions as query. Top five most frequent eGenes from each pathway group are shown. The y-axis is the percentage of pathways within each group that has the corresponding gene as their member gene. For example, in Group 1, six tissue-pathway enrichment records (including two unique pathways; three tissues) were detected by loci2path; LCE3C is a member gene of all the pathways in these six records; LCE3E appears in four out of the six records
