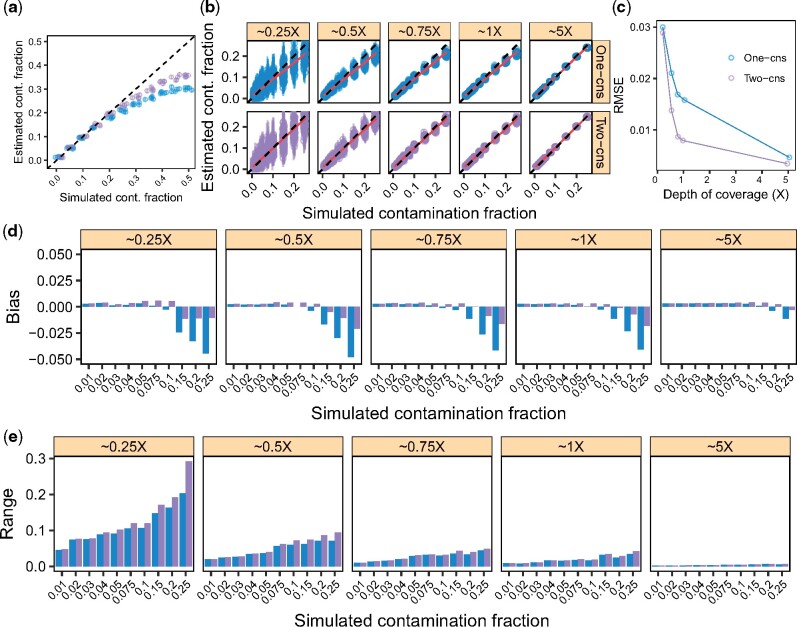
Fig. 1.
Parameter range for c and effect of the DoC on the X-chromosome for the One- and Two-consensus methods. We simulated data as described in Sections 3.3 and 3.4 to explore the contamination fractions and DoC for which our method yields informative estimates: we ‘contaminated’ a Yoruba with a French individual with increasing contamination fractions while controlling for the DoC. (a, b) Contamination estimates for each replicate (points) and corresponding 95% confidence intervals (vertical bars). The dashed lines indicate the expected values and the red lines a linear regression. (c) RMSE for each DoC, combining the results across simulated contamination fractions in (b). (d) Bias for each DoC and contamination fraction combination. (e) Range for each DoC and contamination fraction combination. Results for the ‘One-consensus’ and ‘Two-consensus’ methods are shown in blue and purple, respectively, across all panels

