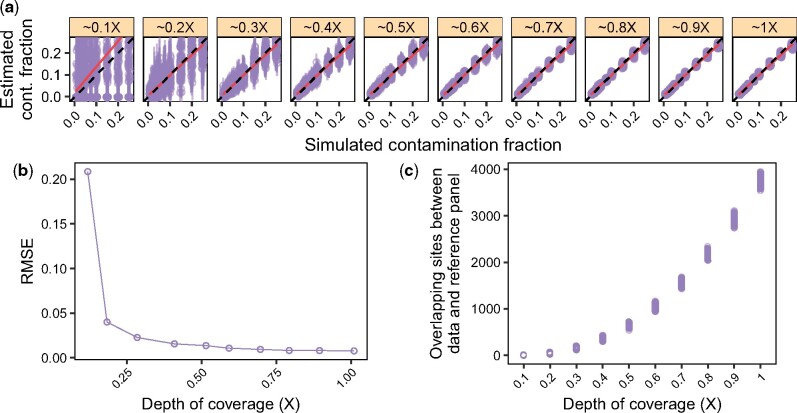
Fig. 3.
Minimum required depth of coverage (DoC) on the X-chromosome. We simulated data as described in Section 3.4, but we considered an additional range of low DoC {0.01×, 0.02×,…, 1×}. (a) Contamination estimates for each replicate (points) and corresponding 95% confidence intervals (vertical bars). Dashed lines indicate the expected values and solid lines show a linear regression. (b) RMSE for each DoC, combining the results across contamination fractions from (a). (c) Number of overlapping sites between the simulated data and the contaminant population panel (HapMap_CEU in this case) after applying the filters detailed in Section 3.1

