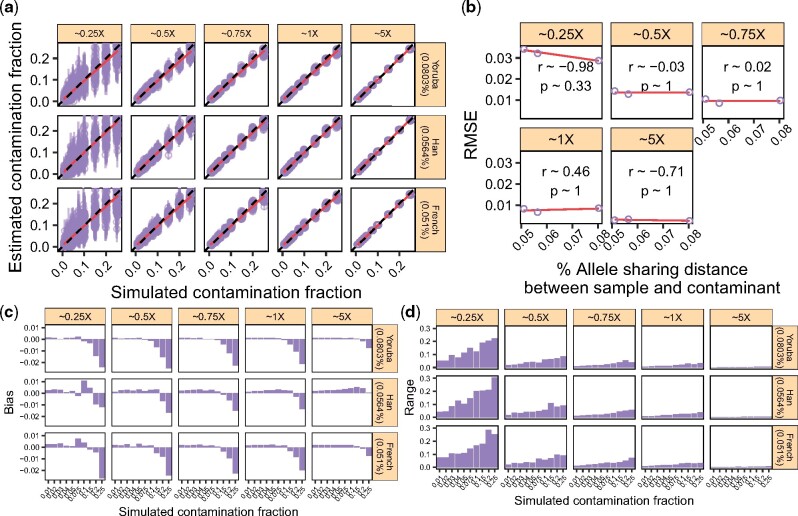
Fig. 4.
The effect of the genetic distance between the endogenous and the contaminant individuals. We considered three individuals (Yoruba, Han, French) and used them to ‘contaminate’ a Sardinian individual (Section 3.7). We simulated data with increasing contamination fractions while controlling for the DoC. (a) Contamination estimates for each replicate (points) and corresponding 95% confidence intervals (vertical bars). Dashed lines indicate the expected values and solid lines show a linear regression. The allele sharing distance between each sample and the contaminant is indicated in parentheses. (b) RMSE for each DoC as a function of the allele sharing distance between the five samples and the contaminant, combining the results across contamination fractions in (a). We show the Pearson correlation coefficient for each DoC. (c) Bias for each DoC, sample and contamination fraction combination. (d) Range for each DoC, sample and contamination fraction combination

