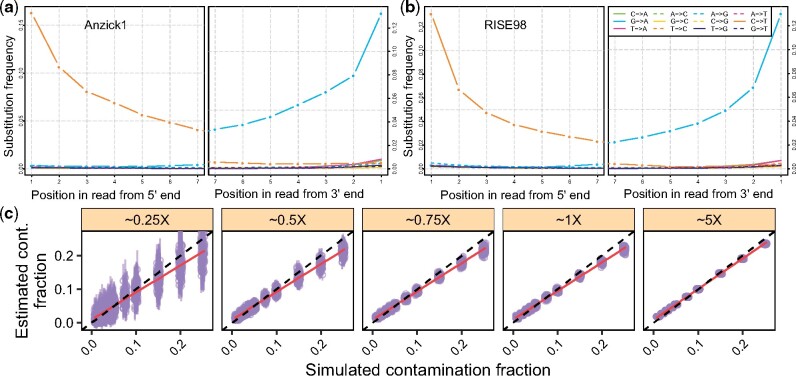
Fig. 8.
The effect of ‘ancient’ contamination. We simulated data as described in Section 3.10. (a, b) misincorporation frequencies with respect to the position from the 5′ (left) and 3′ (right) ends of the reads for the Anzick1 and RISE98 genomes. (c) Contamination estimates for each replicate (points) and corresponding 95% confidence intervals (vertical bars). Dashed lines indicate the expected values and red lines show a linear regression

