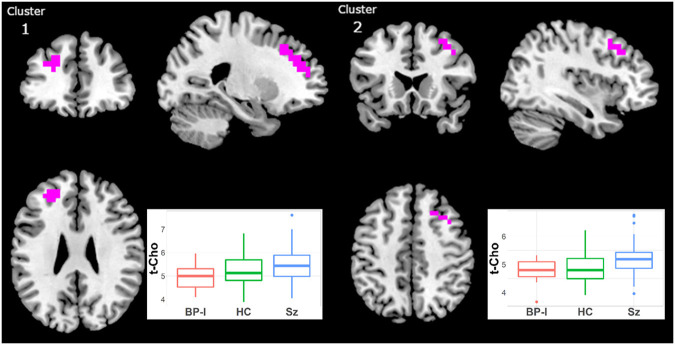
Figure 4.
Increased t-Cho in Schizophrenia (Sz) vs. Bipolar-I (BP) (healthy controls [HC] intermediate) in two clusters: (1) 40 voxels, CCLAV = 0.02, including the left superior frontal gyrus (47.3%) and left middle frontal gyrus (39.2%). (2) 29 voxels, CCLAV = 0.03, including the right middle frontal gyrus (47.3%) and the right superior frontal gyrus (14.6%). Boxplots shows weighted-average t-Cho cluster concentrations in institutional units.

