
Figure 7.
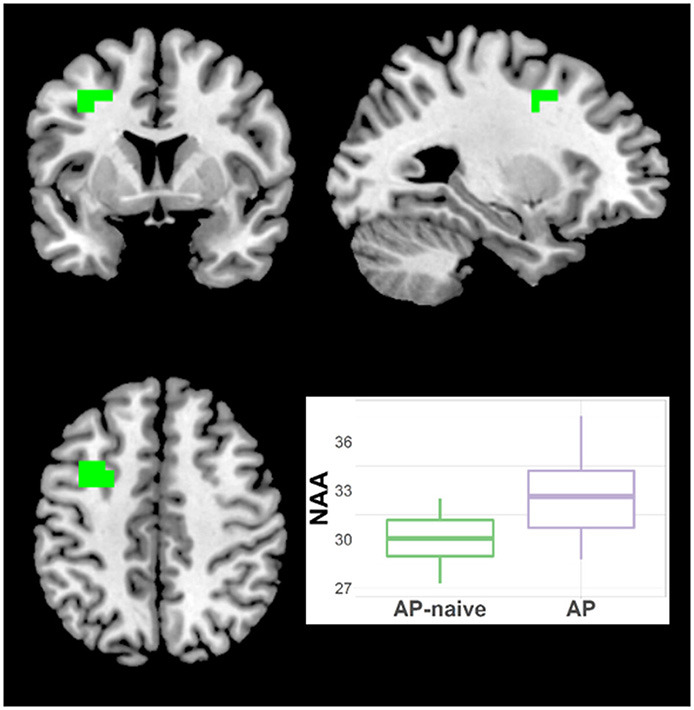
Increased NAA in antipsychotic treated (AP) vs. antipsychotic naïve (AP-naive) Schizophrenia in one cluster: 21 voxels (CCLAV = 0.04), including the left middle frontal gyrus (61.5%%) and left precentral (15.7%). Boxplot shows weighted-average NAA cluster concentrations in institutional units.