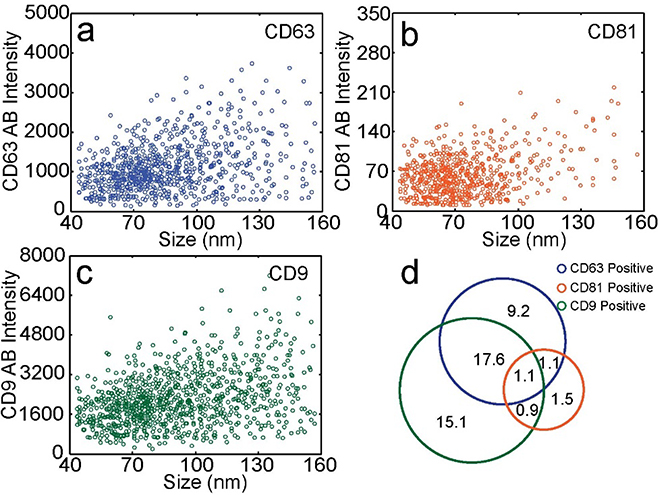
Figure 3.
Correlation between size and protein expression and identification of exosome subtypes. a-c) Scatter plots of seminal exosome size versus antibody fluorescence intensity for a) CD63+, b) CD81+, and c) CD9+ exosomes. For CD63, CD81, and CD9, the typical event frequencies are 40 Hz, 6.9 Hz, and 49 Hz, respectively. d) Percentages of subpopulations of seminal exosomes.

