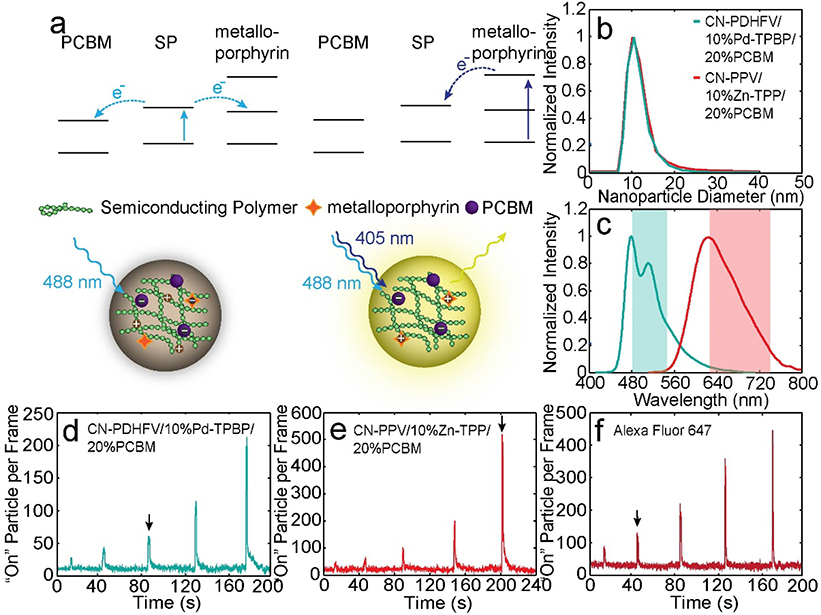
Figure 4.
Optical properties of the superresolution Pdot probes. a) Energy level alignment and working principle of the transistor-like Pdots. b) Size distribution of CN-PDHFV/10% Pd-TPBP/20% PCBM Pdots (cyan) and CN-PPV/10% Zn-TPP/20% PCBM Pdots (red), determined by DLS. c) Emission spectra of the Pdots. The colored bands indicate the filter bandwidth used for imaging. d-f) Switched-on particle per frame trajectories, showing the activation responses of d, e) the two Pdots and f) Alexa Fluor 647 to 405-nm excitation at various power levels. The five peaks from left to right correspond to 405-nm laser activation at 30, 60, 120, 240, and 480 W/cm2. The black arrows indicate the activation powers used for exosome imaging.

