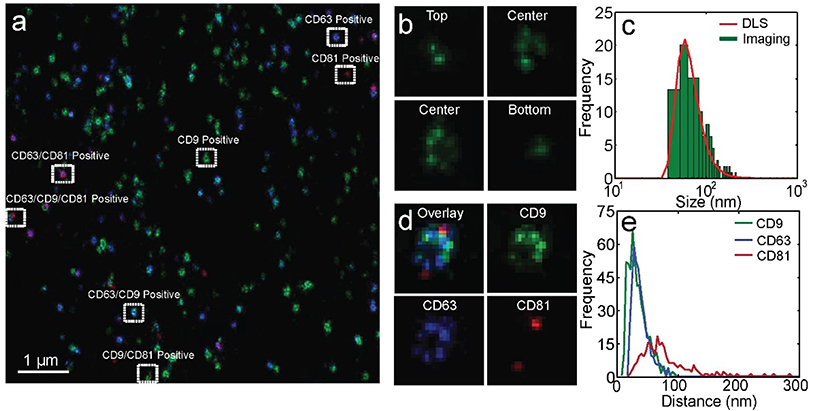
Figure 5.
Multi-color superresolution imaging of exosomes. a) Three-color superresolution imaging of CD63 (blue), CD81 (red), and CD9 (green) on seminal exosomes. Exosomes in different subgroups are highlighted by white rectangles. Scale bar: 1μm. b) Lateral slices of a 3D superresolution image of an exosome. c) Exosome size distribution from image analysis (green bars) and from DLS (red line). d) Zoomed-in superresolution image of an exosome in different imaging channels. e) Inter-protein distance distributions: CD63-CD63 (blue), CD81-CD81 (red), and CD9-CD9 (green).

