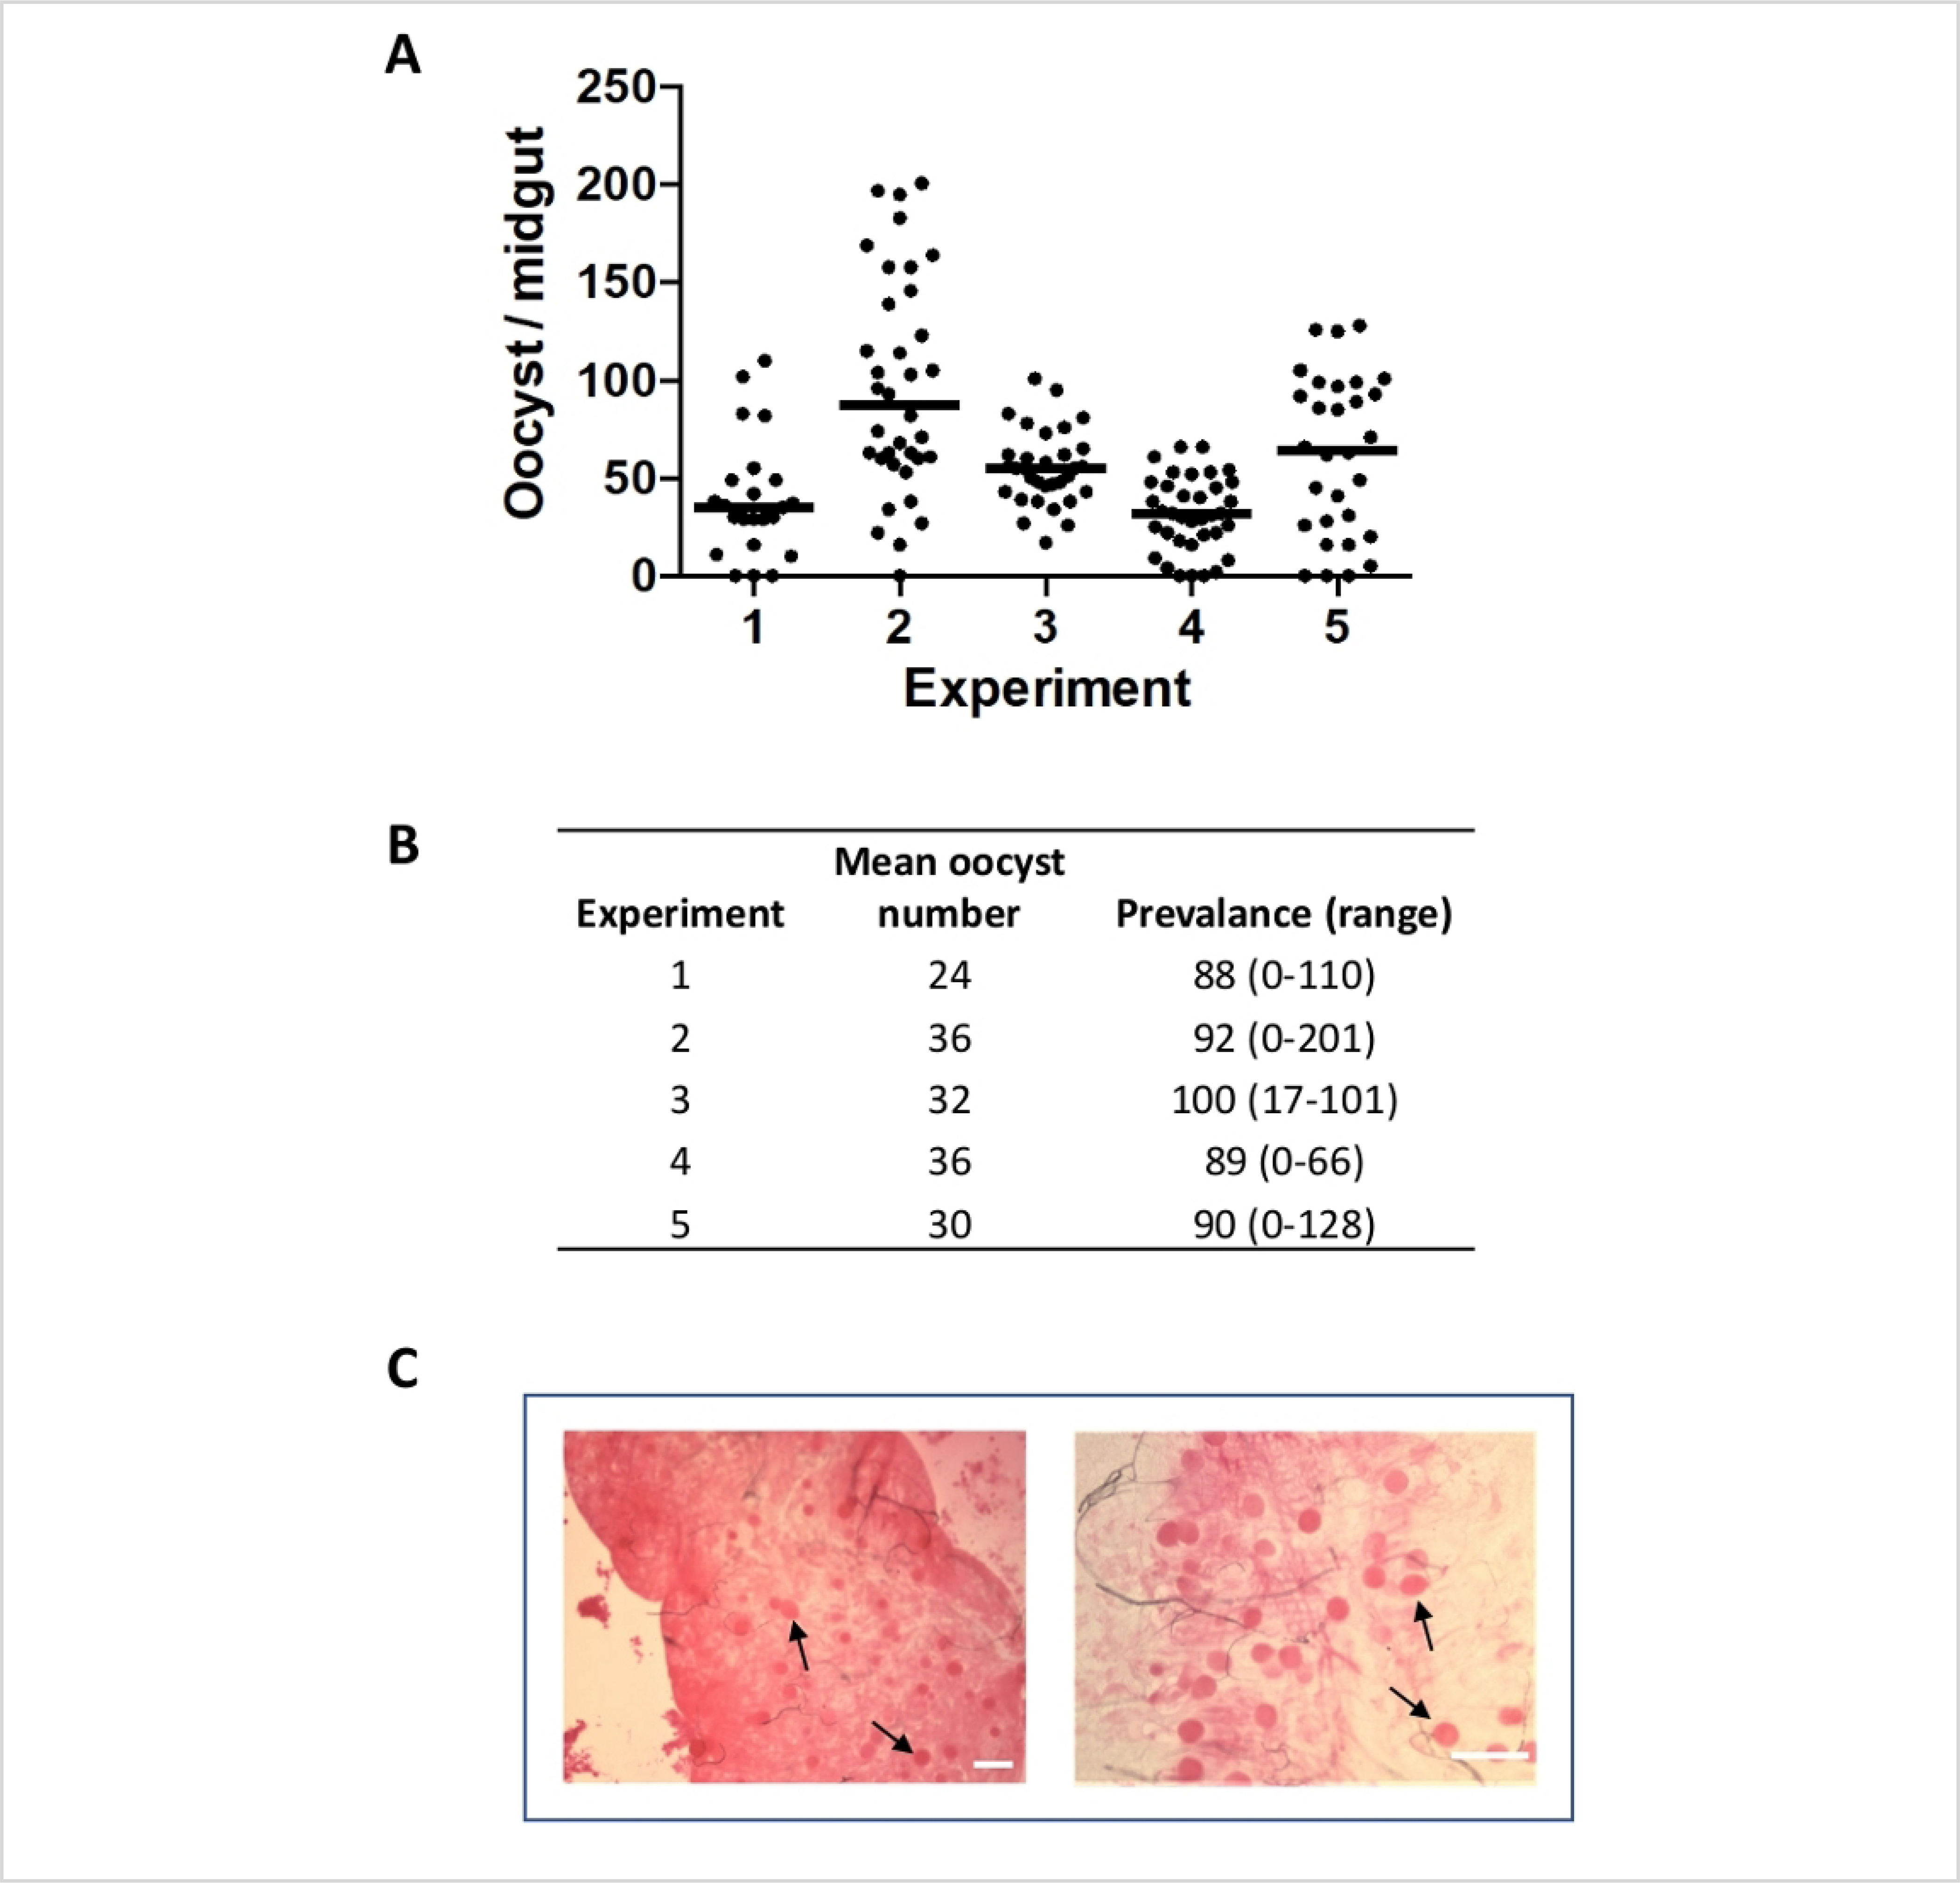
Figure 6: P. falciparum oocysts counts per mosquito midgut.

(A) Graph shows oocyst counts over the years, for each experiment, mosquitoes were fed with 0.3% gametocytes and midguts were dissected on day 8 post blood feed. Each dot represents the number of oocysts from individual midguts and the horizontal line represent median value. (B) Table shows mean oocyst count, prevalence of infected mosquitoes and range of infection. (C) Pictures showing oocysts on mosquito midgut from two separate blood feeding experiments at different magnifications. Scale bar = 150 μm.
