
Fig. 2.
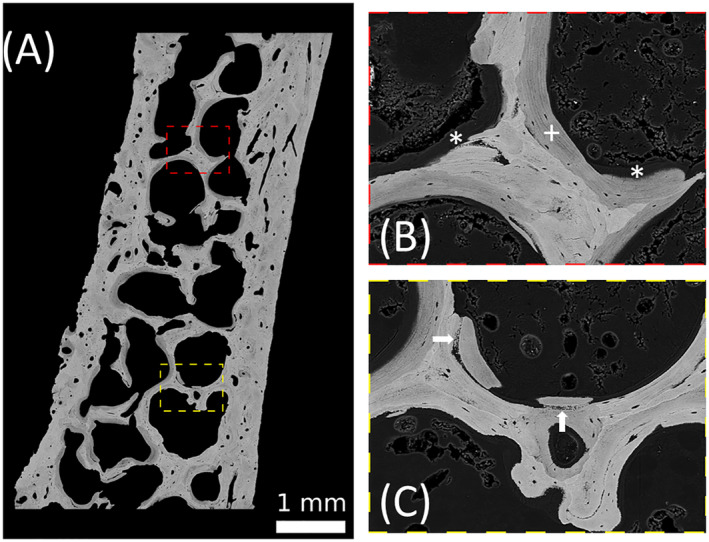
(A) Quantitative back‐scattered electron imaging of the transiliac bone biopsy sample. The pixel resolution is 1.7 μm. Brighter gray levels represent areas with a higher calcium content compared with areas with a lower gray level. (B, C) Images of larger magnification (pixel resolution 0.88 m) of the regions indicated in (A). Regions with large amount of osteoid (mineral content smaller than 1 wt.% ca) are marked with an asterisk (*). They are adjacent to lowly mineralized bone packets (as also found in Fig. 2E, F ) indicated with a plus (+). White arrows show regions of abnormal mineralization with isolated mineral particles close to normally mineralized areas.