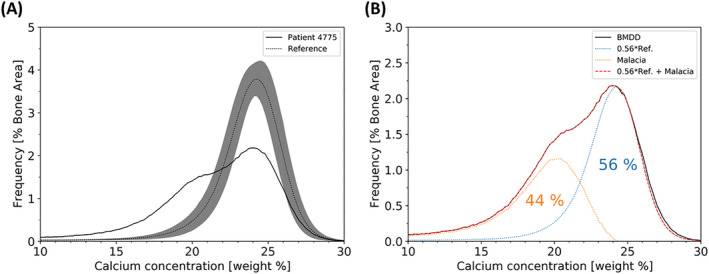
Fig. 3.

(A) The bone mineral density distribution of the patient obtained by qBEI compared with the reference from 25 healthy controls. The curve of the patient shows a double peak compared with the single peak of the reference. (B) Demonstration that the patient BMDD curve can be approximated by a sum of a 56% reference curve and an additional curve shifted to low mineralization values due to the numerous low mineralized bone packets opposed to the normal mineralized bone.
