
Figure 1.
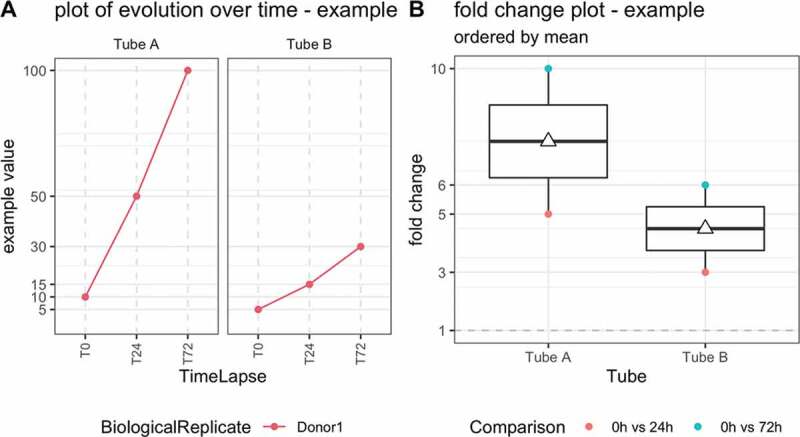
Illustrative example of quality control metric evolution over time for one donor, two tubes and three time points (left) and corresponding boxplot of the fold changes per tube (right). T0 = plasma prepared immediately after blood draw, T24 = plasma prepared 24 hours after blood draw, T72 = plasma prepared 72 hours after blood draw. The white triangle on the boxplot corresponds to the mean