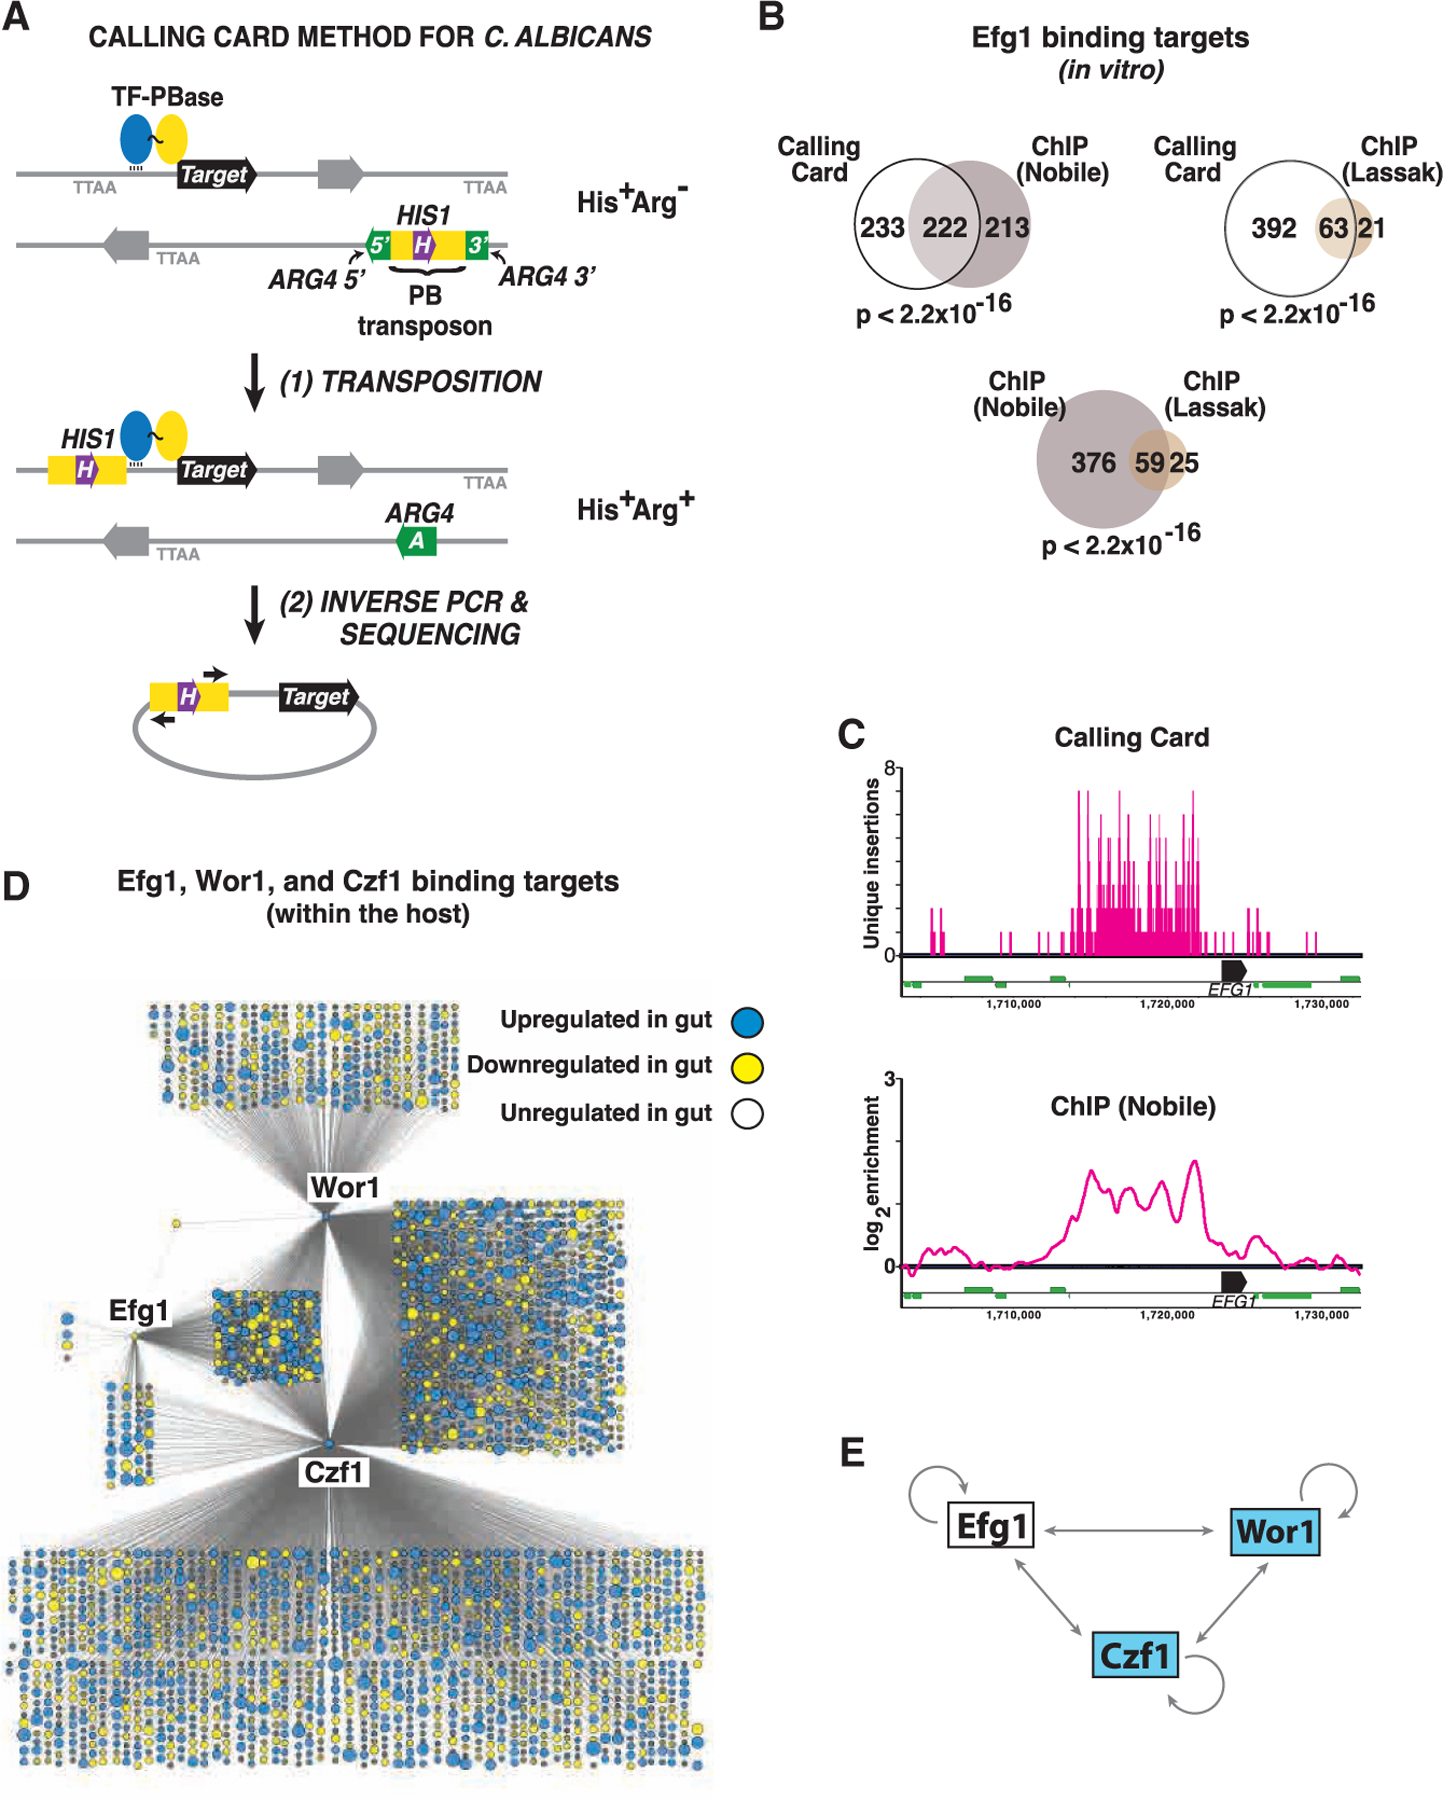
Figure 3. Determination of transcription factor binding sites using Calling Card-seq.

(A) Cartoon of the method. Test strains contain 1 or 2 copies of PB express a TF-PBase fusion protein. Propagation of strains in the laboratory or in a mammalian host allows for PBase-mediated excision of PB from a neutral donor site and reinsertion into a TTAA sequence abutting the binding site of the TF. Transposon excision from the donor site repairs a split ARG4 gene. Because PB is marked with HIS1, cells that have undergone transposon excision followed by reinsertion elsewhere in the genome will exhibit an Arg+His+ phenotype (or Arg+His+Leu+ in cells that contain two copies of PB).
(B) Similar Efg1 binding sites are determined by in vitro CCS and ChIP. Venn diagrams depict the overlap between 455 Efg1 binding targets identified by CCS and targets reported in two previous ChIP studies (Lassak et al., 2011; Nobile et al., 2012); note that only 435 of the 446 Efg1 binding targets reported by Nobile et al. exist in the current C. albicans genome assembly (Assembly 22). Significance of target overlap was determined by Fisher’s exact test.
(C) Comparison of results obtained using in vitro CCS and ChIP for Efg1 binding to the EFG1 locus. CCS results are depicted in the upper panel. Note that a maximum of 2 events can be mapped to a given TTAA sequence depending on the direction of insertion, and vertical bars >1 represent independent insertion events in closely spaced TTAA sequences. ChIP binding peaks reported by Nobile et al. (Nobile et al., 2012) are depicted on the lower panel. Black horizontal bars represent EFG1 ORF, thinner green bars represent neighboring ORFs.
(D) Regulatory networks of Efg1, Wor1, and Czf1 during commensal growth in the host. Each node corresponds to a direct binding target of Efg1, Wor1, and/or Czf1 mapped by in vivo CCS, with node size reflecting the fold-change in expression of the corresponding ORF when WT C. albicans is propagated in the gut compared to in vitro (YPD, 30°C; Witchley et al., 2019). Blue indicates ≥2-fold upregulation in the gut and yellow ≥2-fold downregulation (adjusted p < 0.05 using a linear fit model).
(E) Schematic of cross regulation among Efg1, Wor1, and Czf1 within the host digestive tract. Results obtained with in vivo CCS suggest that, unlike under in vitro conditions, a/α cells express all three regulators within the mammalian gut.
