
Figure 14.
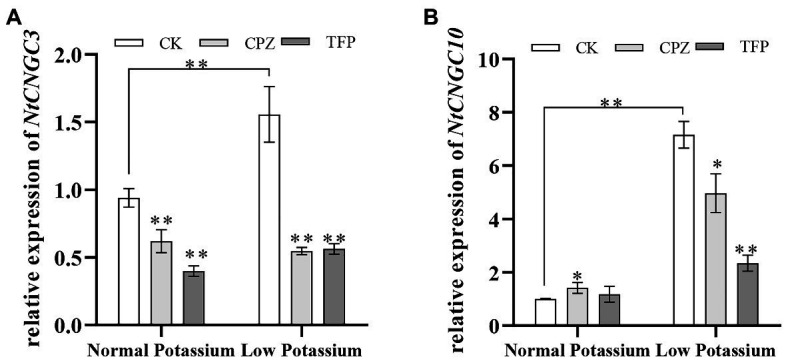
Expression of NtCNGC3 (A) and NtCNGC10 (B) in antagonist-treated tobacco plant roots and CK tobacco plant roots under normal and low potassium levels, as detected by RT-qPCR. * and ** indicate significant differences between CK and treated plants at p < 0.05 and p < 0.01, respectively, by Student’s t-test.