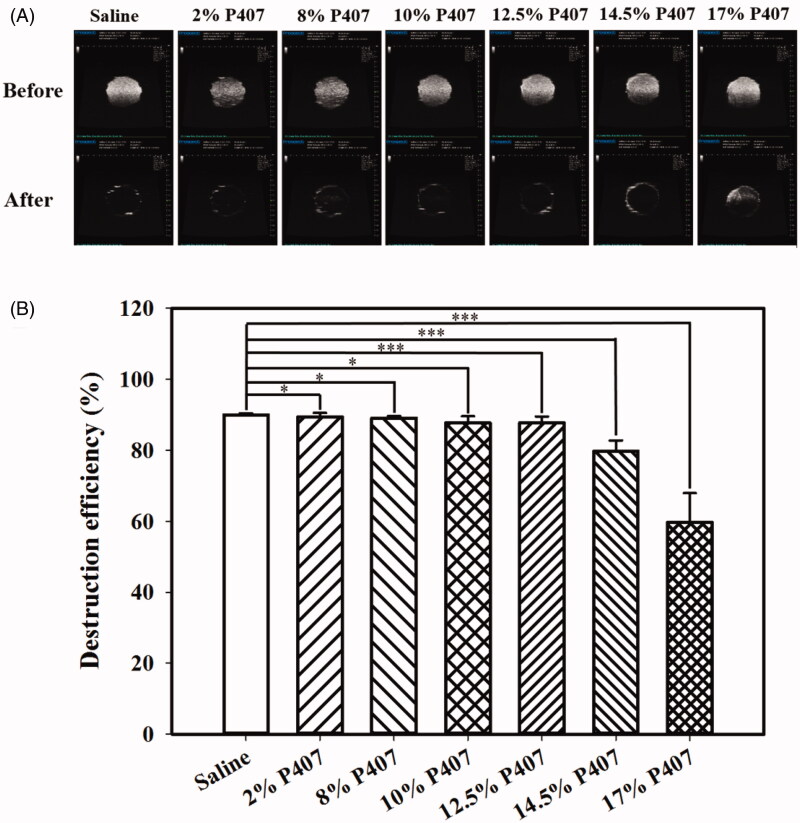
Figure 4.
(A) High-frequency US images of MBs before and after US sonication. (B) Quantification of the disruption efficiency. Values are expressed as the mean ± SEM (n = 5 per group). US, ultrasound; MBs, microbubbles. *p < .05; **p < .01; ***p < .001; #p < .001 relative to the control group; one-way ANOVA followed by Tukey’s multiple-comparisons test.

