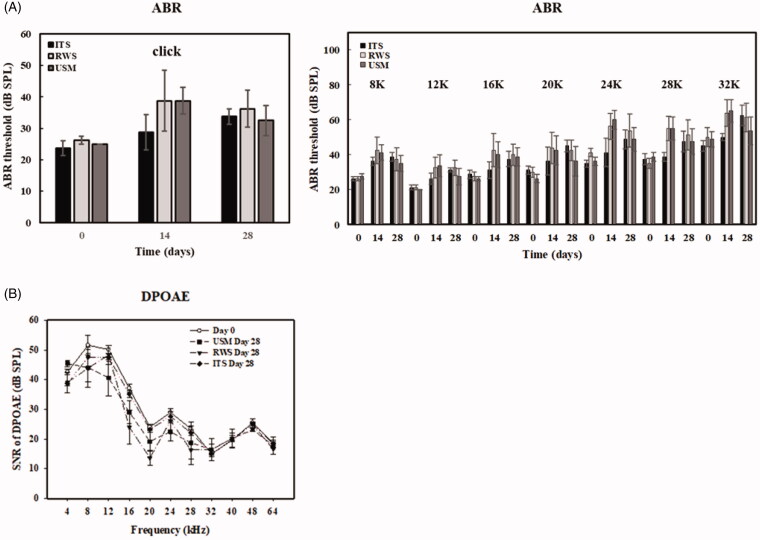
Figure 12.
Hearing assessment in guinea pigs after USM treatments. (A) The auditory brainstem response (ABR) threshold recording with click and tone burst stimuli before (day 0) and at a 1-month follow-up in USM, RWS and intratympanic saline injection without MBs (ITS). groups. The results are expressed as the mean ± standard error of the mean (SEM), with n = 4 for each bar. (B) Signal-to-noise ratios (SNRs) of the cubic difference distortion product (2F1–F2) at different center frequencies (FCs) for each group. The results are expressed as the mean ± SEM, with n = 4 for each group; one-way ANOVA followed by Tukey’s multiple-comparisons test.

