
Figure 2.
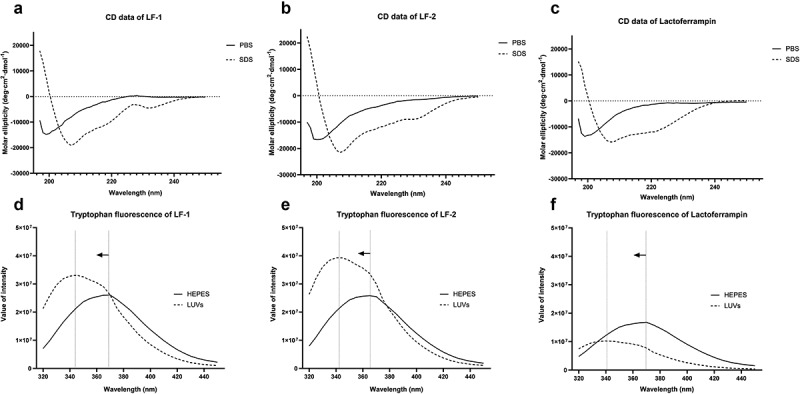
Circular dichroism and tryptophan fluorescence spectra of LF-1 (A, D), LF-2 (B, E), and lactoferrampin (C, F) in free solutions (PBS or HEPES) and membrane-mimetic solvents (SDS or LUVs). In the tryptophan fluorescence spectra, arrows indicate a blue shift of peak fluorescence towards a shorter wavelength