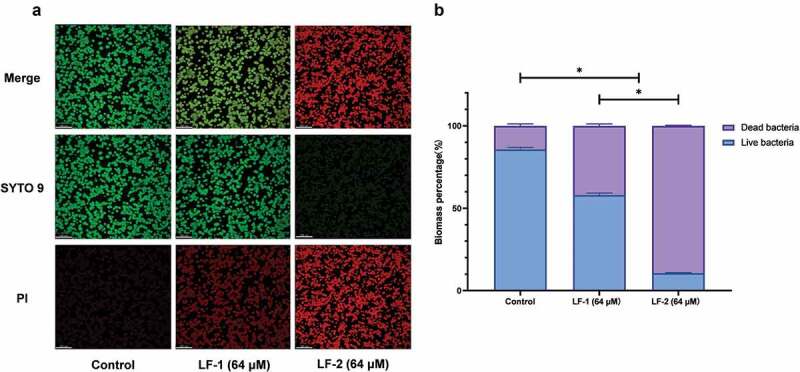
Figure 5.

(A) Representative CLSM images of live, dead, and merged bacterial cells in preformed S. mutans biofilms treated with peptides for 24 h. Live cells are stained green with SYTO 9, whereas dead cells are stained red with propidium iodide (PI). (B) Biomass percentages of live and dead cells, calculated according to five randomly selected images. Data are presented as the mean ± SD (*p < 0.05)
