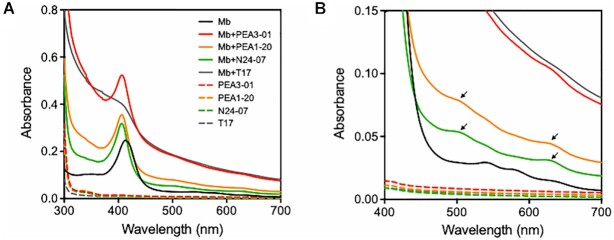
Figure 5.
Absorption spectra of myoglobin (Mb) alone, DNA alone, and myoglobin-oligonucleotide mixtures in potassium acetate buffer (pH 5.0). T17 was used as a negative control. (A) Spectra in the 300–700 nm range to observe a Soret peak. (B) Graph showing enlarged spectra in a visible region (400–700 nm) from (a). DNA and myoglobin concentrations were each set at 10 μM. The arrows indicate generated peaks distinct from myoglobin only when PEA-myoglobin complex formation occurred.

