Figure 2.
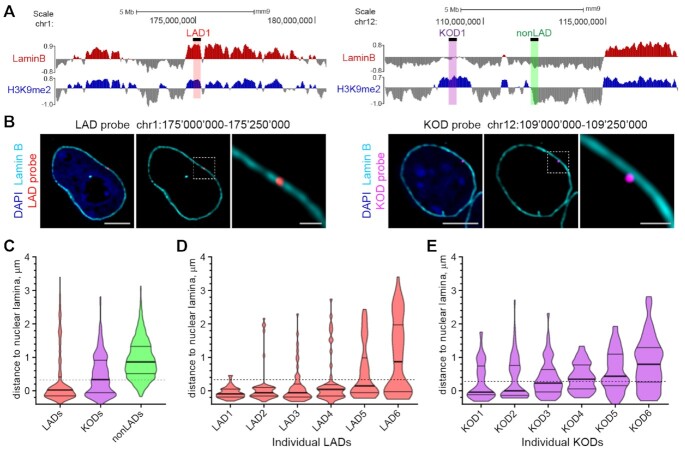
KODs are localized at the nuclear periphery. (A) Genomic locations of DNA oligo probes targeting a LAD (left panel; red highlight), a KOD (right panel; purple highlight) or a non-LAD (right panel; green highlight) shown with corresponding genome tracks (mm9) for H3K9me2 and Lamin B ChIPseq from mESCs. 250 kb regions targeted with DNA oligo probes shown as black bars above Lamin B tracks. (B) Localization of regions from a LAD and a KOD in interphase mESCs. Representative immuno-FISH images of cells hybridized with fluorescent DNA oligo probes targeting an individual LAD (red; left 3 panels) and an individual KOD (purple; right 3 panels), and immunostained for Lamin B (cyan) and DAPI (blue). Area in dotted boxes highlighted in right panel of each set. Scale bars: 5 and 1 μm. (C) Violin plots show distribution of distances to the nuclear periphery (as defined by Lamin B) of individual LAD, KOD, or nonLAD probes for ≥300 target loci. (D, E) Violin plots show distribution of distances to the nuclear periphery (as defined by Lamin B) for six individual (D) LADs or (E) KODs; n = 50 target loci in 25 cells. All KOD probes target saKODs. For C–E, dotted line indicates average thickness of H3K9me2 peripheral chromatin layer. Lines on violin plots show median, 25% and 75% quartiles. Statistical analysis was performed using ANOVA Kruskal-Wallis test with Dunn's multiple comparisons and Mann Whitney test; see Supplemental Table S2.

