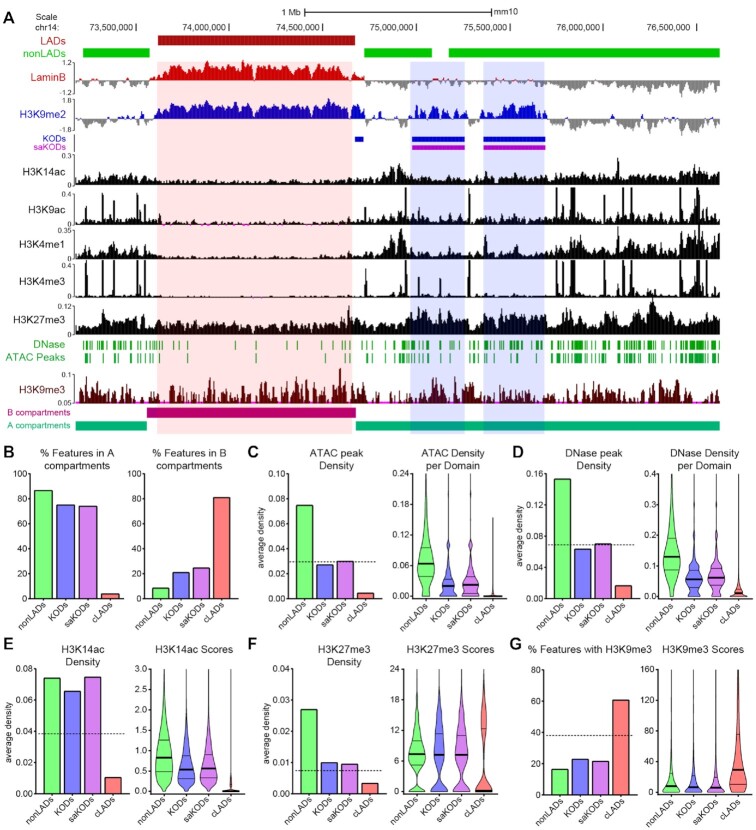
Figure 3.
KODs mark regions of accessible chromatin. (A) UCSC genome browser view (mm10) showing LADs (red bars), nonLADs (green bars), KODs (blue bars), and saKODs (purple bars) with representative genome tracks for Lamin B ChIPseq, histone marks as indicated, DNase and ATAC peaks, and A/B compartments. All datasets from mESCs. An example LAD (red highlight) and 2 example KODs (blue highlights) are shown. (B) Percent of each domain type associated with A (left) or B (right) compartments. (C) ATAC peak density per kb plotted as a domain-wide average (left panel) or distribution of densities across all domains of each type (right panel). (D) DNase peak density per kb plotted as a domain-wide average (left panel) or distribution of densities across all domains of each type (right panel). (E, F) Density per kb plotted as domain-wide average (left panel) or distribution of scores (signal intensity) per domain for each type (right panel) for (E) H3K14ac and (F) H3K27me3 peaks. (G) Percent of each domain type with H3K9me3 enrichment (left panel) and distribution of H3K9me3 scores per domain for each type (right panel). Dotted lines in left panels of C-G indicate genome-wide average for each category plotted. Lines on violin plots show median, 25% and 75% quartiles. Statistical analysis was performed using ANOVA Kruskal-Wallis test with Dunn's multiple comparisons and Mann–Whitney test; see Supplemental Table S2.

