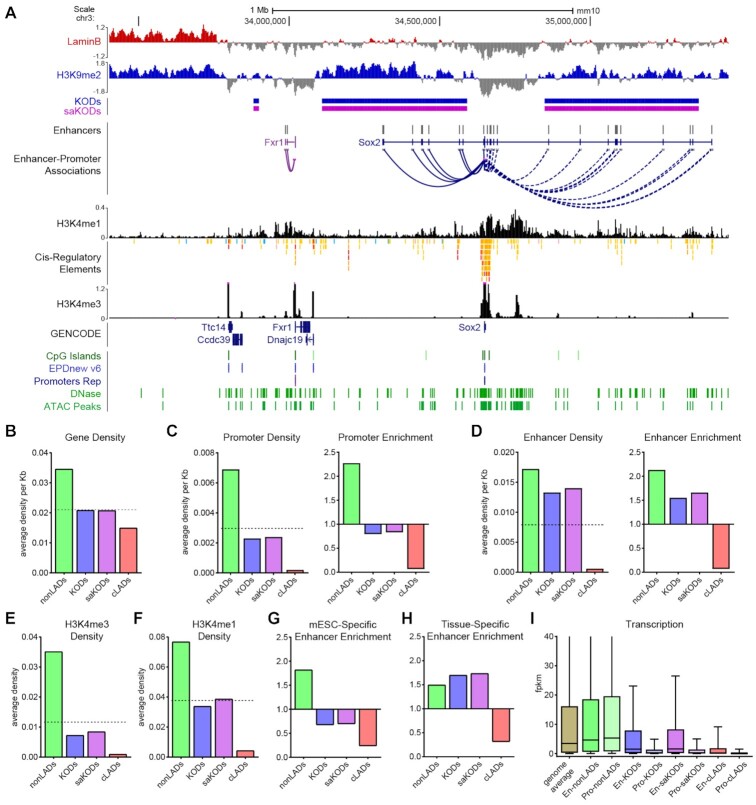
Figure 4.
KODs are enriched for transcriptional enhancers. (A) UCSC genome browser view (mm10) of the Sox2 locus with its associated enhancers, many of which are in KODs surrounding the Sox2 gene body (GENCODE Track). Displayed tracks are Lamin B ChIPseq, histone marks as indicated, DNase and ATAC peaks, and CpG islands (all datasets from mESCs). Enhancers and predicted Enhancer-Promoter associations based on ENCODE panel of 72 mouse tissue-stages (44). (B) Domain-wide average gene density per kb of each domain type. (C, D) Domain-wide average density per kb of each domain by type (left panel) and enrichment (fold change observed over expected for randomly permuted genomic regions of equal size) for each domain type (right panel) for promoters (C) and enhancers (D). (E, F) Domain-wide average density per kb of (E) H3K4me3 and (F) H3K4me1 peaks per domain type. (G) Enrichment of mESC-specific enhancers by domain type. (H) Enrichment of all tissue-specific enhancers (not including mESC-specific enhancers) by domain type. (I) Transcription (FPKM) for genes associated with promoters or enhancers located in each domain type. Dotted lines in B–F left panels indicate genome-wide average for each category plotted. Statistical analysis for enrichment was performed using GAT with 1,000 permutations each; all other statistical analysis was performed using ANOVA Kruskal-Wallis test with Dunn's multiple comparisons; see Supplemental Tables S2 and S3.

