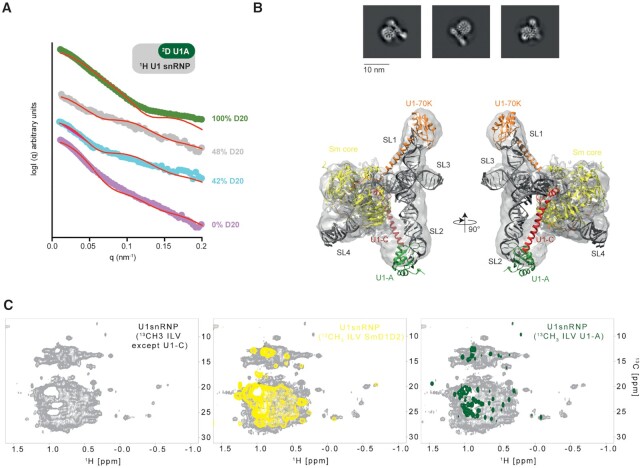
Figure 2.
Structural analysis of the in vitro reconstituted U1 snRNP. (A) Plot of the scattered intensities as a function of the q factor (or angle). Experimental curves are colored according to the percentage of D2O included in the solvent (0, 42, 48 and 100% are shown in pink, blue, gray and green, respectively). Back calculated curves are shown as red curves. The following χ2 2.72, 1.89, 1.98 and 1.82 were obtained for the data recorded in 100, 48, 42 and 0% D2O. (B) Representative 2D class-averages of the U1 snRNP particles. Atomic model of U1 snRNP (17) rigid-body fitted into the 9.8 Å resolution cryo-EM map. (C) NMR spectra of U1 snRNP. On the left, 2D 1H-13C HMQC of U1 snRNP 13C-labeled on ILV methyl groups of all the proteins except U1-C. In the middle, the yellow spectrum corresponds to the 2D 1H-13C HMQC of U1 snRNP 13C-labeled on ILV methyl groups of Sm D1-D2 in U1 snRNP. On the right, the green spectrum corresponds to the 2D 1H-13C HMQC of U1 snRNP 13C-labeled on ILV methyl groups of Sm D1-D2 in U1 snRNP.

